


In attendance:
| Thomas Becker (AIP) | |
| Petra Böhm (AIP) | |
| Lise Christensen (AIP) | |
| Pierre Ferruit (LYO) | |
| Matthew Horrobin (MPE) | |
| Knud Jahnke (AIP) | |
| Andreas Kelz (AIP) | |
| Arlette Rousset-Pecontal (LYO) | |
| Martin Roth (AIP) | |
| Sebastian Sanchez (AIP) | |
| Marco Scodeggio (MIL) | |
| Marc Verheijen (AIP) | |
| via TELECON from ESO/Chile: | |
| Markus Kissler-Patig (ESO) | |
Index :
1st Day of Meeting:
Welcome, Introduction, Philosophy
Status Data Format & C Library
DEMO of Prototypes & existing Tools
Status of prototyping within Euro3D
Specific Problems, open Discussion
Summary of Day 1 & TELECON
2nd Day of Meeting:
Technical Issues (Coding,Interfaces,Layout,...)
Specific Problems for large Datasets (MUSE)
Workplan (Priorities, Timeline+Milestones, Participation)
TELECON
Summary of Milestones and Action Items
It was agreed that the first and foremost purpose of the meeting should be to start a brain-storming process, to collect ideas, and to prepare a wish list. Following this discussion, a specification document should be destilled soon after the meeting.
Martin reminded everyone that the implementation of the vtool as well as other Euro3D software developments would have to be in accord with the decisions and resolutions of the preceeding OPTICON 3D Spectroscopy Working Group, see Report of Marseille meeting .
It was commonly agreed that the vtool, as a minimum, should provide the following basic functionalities:
Later during the meeting, Marc pointed out that the vtool , from a very general point of view, would have to serve two distinct purposes:read 3D data (Euro3D Format) display 2-dimensional maps display 1-dimensional spectra provide interactive support to select & display spectra from map representations, and vice versa allow for other forms of representation ("long slit" projections, 3D rendering of entities like e.g. emission line clouds, browsing through datacube ="movie", etc.) the ability to export derived data sets (selected/co-added spectra, maps, ...)
When designing the layout of the vtool software, it might be worthwile to consider the different requirements arising from these two ways of usage (e.g. graphical support for seeing the "big picture" in a velocity field vs. detailed inspection of faint spectral features, finding potential data flaws, etc.).inspecting data (data quality assessment) understanding data (physical analyis)
It became obvious, that, depending on the peculiar scientific interests of the participating groups, somehow also related to specific properties of the most favoured instrument, there will be quite different demands and priorities from group to group. Sebastian emphasized that the design of the vtool has to be as general as possible in order to accomodate all currently foreseeable needs. It must not be designed such that, for example, any of the data sets provided by instruments of Euro3D participants would remain unsupported.
A number of other more detailed requirements, which had been put forward
during this part of the discussion, will be listed below.
The main difference of the new scheme is how the data is stored on disk.
Instead of splitting DATA, QUALITY, and NOISE over different extensions,
each row of the bintable corresponds to one spectrum with the complete
signal, quality, noise, and the position information.
A significant advantage in terms of I/O performance is related to the
fact that it is no longer necessary to swap between different FITS extension
when accessing the data.
As a drawback, it will no longer be possible to use a conventional FITS viewer to access and display the stacked spectra as images.
Some instruments, in particular those of the TIGER-type principle of operation, have spectra which are only partially filled with valid data. As an amendment to the previous draft, Pierre explained that it was now considered to no longer flag undefined spectral bins in the quality extension, but to introduce two new columns NPIX and INDEXSTART, mapping the valid spectral bins into the total free spectral range. On the other hand, it would be desirable to have the data aligned in identical wavelength columns.
Sebastian observed that the current data format specification does not make provision for a relative humidity entry, which is however crucial for the atmospheric dispersion correction. Furthermore, the unit of SIZE must be the same as XPOS. SHAPE should be of type CHAR, and a convention was necessary to define all known forms of geometry.
Matthew was wondering whether or not the occurence of rebinning during the process of data reduction was retained in some sort of history record.
Following Pierre's presentation, Arlette reported the status of the Lyon C-library, whose development was significantly affected by the data format modification. Except for the group information, the major C structures and supporting I/O routines are now available. After the Lyon Mini-Workshop on December 4/5, 2002, Sebastian had obtained a preliminary version of the library and was using it successfully for his prototyping work. Access to the data cube was either "slice-oriented" or "spectra-oriented", e.g.:
  get_E3D_spectrum             /* obtain spectrum for a specified spaxel */
  get_E3D_slice                /* obtain intensities of spaxels at a given wavelength bin */
  get_E3D_frame                /* obtain set of stacked spectra */
The corresponding C functions were callable from C++.
C structures are available for :
- E3D data
- images
- spectra
- spaxel
- ...
Functions open_frame(___,___) are
available to read any FITS data entity into a corresponding C structure.
There is work in progress to implement flag-controlled selection tools, i.e. digital apertures, bad pixels, ...
Conversion between different data formats is also supported (MIDAS, IRAF, E3D, FITS).
There are routines available for the interpretation of UNIX style command line options for C programmes which are run from the command line or scripts.
The current status of documentation is limited to descriptive information at the source code level, basically summarizing each function in its header. There is also a tool-generated inventory of all functions of the library.
Sebastian made the remark that in order to continue with his prototyping work on the vtool there was the need to include some level of group table handling in the library.
Arlette concluded her presentation with a list of remaining TODO items:
An alpha Version of the library would become available at the end of February 2003. Anyone interested to start working with the library earlier than that is requested to contact Arlette for obtaining a preliminary version (usage at your own risk).include START and STEP WCS debug selection
Using a laptop + beamer, Thomas gave a presentation of the MONOLOOK tool that he had developed under IDL for the inspection and analysis of PMAS data, and which is part of the P3d package. This software has also been used extensively for MPFS data and works fine for datacubes with an orthogonal spatial sampling. There is no provision for mapping other geometries (fiber bundles, hexagonal lensarrays, etc.).
MONOLOOK uses one window with three basic panels:
On the right side of the window, there is also a number of menu buttons to control a few basic functions. The bulk of selectable options,panel of stacked spectra (intensity image) panel for up to 12 maps plus magnified panel for currently selected map panel of selected spectrum (line plot)
The bottom line of this kind of layout is the ability to satisfy the condition of quickly changing from a spectral representation to a spatial representation, and vice versa. Martin pointed out that this ability is crucial for the "inspection" type of usage, where one is interested to identify spectral lines, determine whether a faint spectral/spatial feature is real or just a flaw, etc. Clearly, the total view of thousands of spectra for some of the larger IFUs was not going to be practical (e.g. VIMOS), but for those cases it would be possible to define regions-of-interest, thus constraining the number of spectra to a sensible limit.
Other options of MONOLOOK include a crosshair which is simultaneously projected across the stacked spectra and the spectrum plot panels with a numerical indication of wavelength, the possibility of selecting spaxels by mouse-click to form arbitrary digital apertures, to generate co-added spectra for digital apertures, to select a wavelength interval by mouse clicks and co-add datacube slices to form a pseudo narrowband/broadband map, contour plots for map panels, and a variety of scaling options. Through two different OBJECT and SKY channels is is possible to co-add spectra within different digital apertures to perform basic spectrophotometry with sky background subtraction (but see caveat below). MONOLOOK satisfies also the requested ability to export derived entities by returning arrays of spectra and arrays of maps through procedure parameters on the IDL command line.
Sebastian said that having the opportunity of showing more than one map was very useful indeed. Generally, the layout of switching between spectral and spatial representations like the one shown in MONOLOOK was a good approach. Whether or not one wanted to restrict the panels to a single window remained to be discussed.
Pierre pointed out that a journaling option along with the storage of results was a very desirable feature. Typically, working with the data could be broken down into 2 phases: first inspection, and then detailed work + fine tuning of parameters. The second phase would benefit greatly if the vtool incorporated a scripting and log functionality.
In the second part of his presentation, Thomas showed the example of a datacube of a standard star which had been observed with PMAS. Just bluntly selecting a digital aperture as shown in Fig.3 and co-adding the spectra of selected spaxels yields the combined spectrum (white line) of Fig.5. Owing to of differential atmospheric refraction, a somewhat offset aperture (Fig.4) yields a systematically different flux distribution (red line). In the datacube picture, differential atmospheric refraction is equivalent to a spatial shift of the PSF centroid with wavelength (as discussed by Arribas et al. 1998, A&ASS, 136, 189). The effect of atmospheric refraction had been subject of debate in the Milano and Marseille Working Group meetings, and it is now clear that it must be accounted for in the vtool programme, since the Euro3D Data Format allows to carry data which have not been corrected for refraction.
DECISION: it was unanimously decided to incorporate an option for differential atmospheric dispersion correction in the vtool.
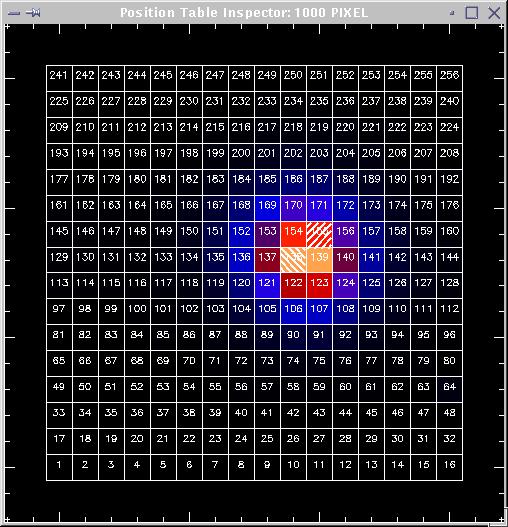 Fig. 2 |
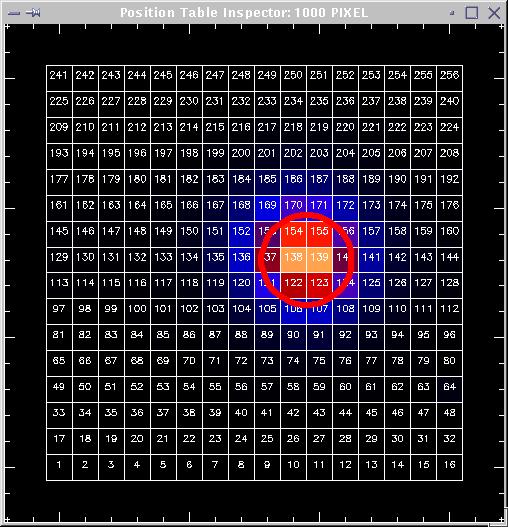 Fig. 3 |
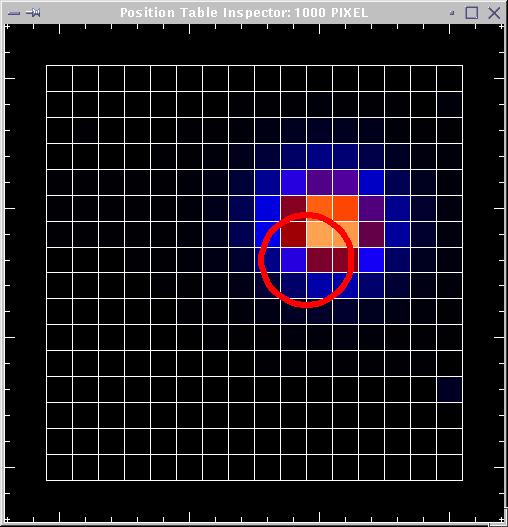 Fig. 4 |
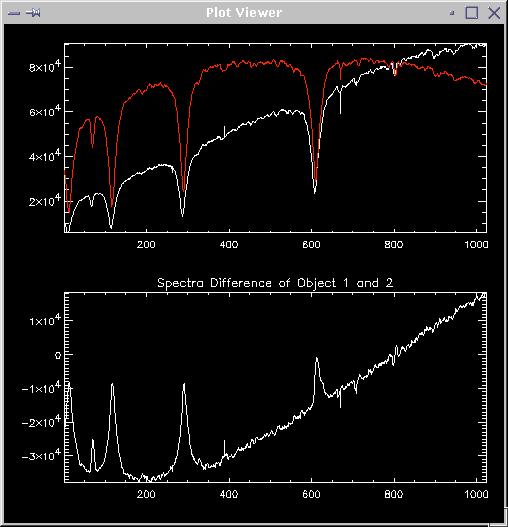 Fig. 5 |
2. GIPSY
Marc gave a presentation of the GIPSY visualisation tool that he is
using for radio astronomy data cubes. Because of the limited screen size
of the laptop-beamer combination, he gave a demo of this
software on the computer in his office, using a 21' monitor.
GIPSY is the
Groningen Image Processing System.
It is a highly interactive software system for the reduction and display
of astronomical data. It supports multi-tasking using a versatile user
interface, it has an advanced data structure, a powerful script language
and good display facilities based on the X Window system. It was designed
originally for the reduction of interferometric data from the Westerbork
Synthesis Radio Telescope, but in its history of more than 20 years it
has grown to a system capable of handling data from many different instruments
(e.g. TAURUS, IRAS etc.).
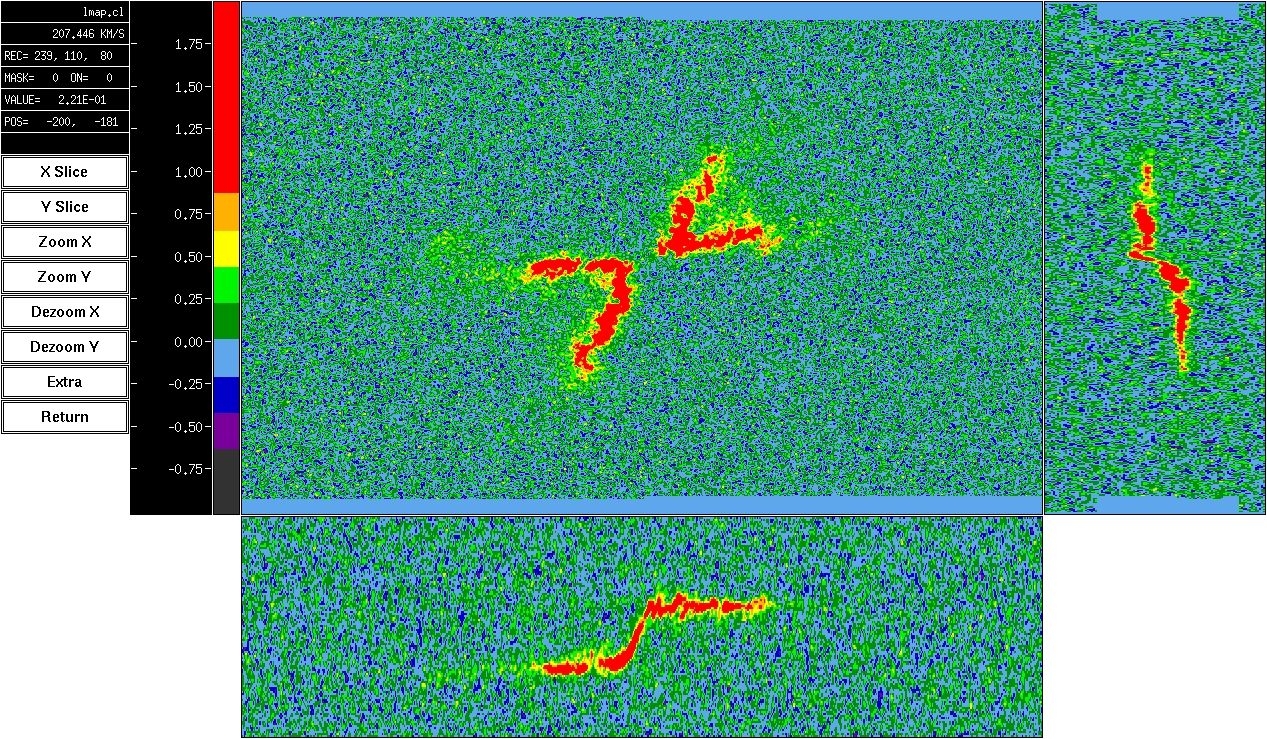
GIPSY provides a command line, and a separate window for the vtool. Marc loaded the H I datacube of a nearby galaxy and demonstrated some useful features which help to understand the velocity structure in this object. The size of the datacube was 1024x512 spaxels with 110 wavelength slices. Along the lines of the two fundamental approaches ("inspecting"/"understanding"), and complementary to the MONOLOOK functionality, GIPSY provides an example of how one obtains a quick overall picture of the velocity field, supporting various ways to look into the data. Using the mouse, it is possible to browse quickly through the cube in wavelength, resulting a a movie effect. The movie can be run automatically within a mouseclick-defined interval back and forth - until interrupted with another mouse click. It is also possible to loop over arbitrary channels and split the screen for different representations simultaneously. Through a panel of buttons various options to modify the color lookup table (LUT) are available, including a pseudo-contour effect produced by setting LUT wedges. The vtool is capable of communicating with the command line, e.g. to transform spaxel position into coordinates on the sky. Again with simple mouse clicks one can generate projected views of the datacube in (RA, Lambda) or (DEC, Lambda), which are equivalent to simulated longslit spectra along the given spatial coordinates, thus supporting intuitively the understanding of rotation curves. Pseudo-longslit projections are also possible along arbitrary cuts of the RA,DEC plane. One can move these cuts in real-time. Using mouse-generated polygons of various shapes (circles, ellipses,...), one can isolate regions of interest or block-out flawed data and otherwise disturbing areas. A separate plotting window supports the display of an H I line profile, however somewhat less comfortably when compared with MONOLOOK. Also in a separate window, it is possible to create a rendered 3-dimensional visualization of an emission line region and rotate this object across an arbitrary axis in space - but Marc was unsure whether this feature was really so useful for many applications.
Marc commented that an advantage of the GIPSY vtool was that any display of maps was free of spatial interpolation, contrary to some other viewing tools, e.g. DS9.
Martin observed that the number of spaxels of the demo data cube was roughly 6 times as large as the largest optical datacube one could imagine in the foreseeable future (MUSE), however the number of spectral bins was one order of magnitude smaller then the one for MUSE. Qualitatively one can say that as long as one was confronted with an orthogonal datacube, the typical amount of MUSE data alone was not prohibitive to be conveniently visualized with GIPSY, even on the basis of current computer technologies.
Marc displayed also a VLA mosaic of 10 pointings over a cluster of galaxies, showing many faint objects at the S/N limit. Again, the mouse-controlled browsing function proved to be useful to identify extended objects near the detection limit on the grounds of a changing appearance due to the rotation curve of the H I emission. Marc explained that the eye is sensitive to pick up structure even in the presence of noise, thus visualization was a powerful tool to detect faint features.
In summary, the demo showed that GIPSY is a very well-developed tool
with an excellent and intuitive real-time support of map-related visualization
functionality. Owing to its major field of application in radio astronomy,
the display of spectra is also possible, but perhaps less well supported
as one would desire for optical spectroscopy.
DECISION: it was decided to use the PGPLOT library for plotting functions
Sebastian explained that there is a fundamental difference between the display of maps as provided e.g. by GIPSY and MONOLOOK, namely the requirement to plot spaxels rather than uniform maps on an orthogonal grid. This requirement is a consequence of the data format philosophy, which allows to preserve the original spectra without spatial interpolation. This feature is especially relevant for fiber bundle IFUs (e.g. INTEGRAL, SPARSEPAK) and IFUs with hexagonal spaxels (e.g. GMOS). Since PGPLOT supports the display of polygons, but does not provide LUTs for polygons, such a function had to be emulated (pseudo-LUT for polygons).
Using the beamer and the laptop as X-Terminal via LAN for the computer in his office (Pentium IV, 1.7GHz,256MB), Sebastian gave a presentation of the prototype features that he had coded so far. Fig.9 shows a map of a SAURON datacube (Fig.8), and the same map with a different LUT is shown in Fig.10. The square appearance of the spaxels having a tilt with respect to the lensarray angle is a consequence of the lack of group information. The window showing this plot was produced from a UNIX command line call with brightness/contrast parameters, no. of spaxels, no. of channels, etc. Using another parameter, the spaxel appearance was changed from square to circle. The display was very fast, even over the LAN. Another command provides export of the screen image to a postscript file on disk. The protoype was fully compatible with the Lyon C Library and the Euro3D Data Format, except for groups.
Using a PMAS datacube of a standard star exposure, Sebastian demonstrated the following functionalities:
plot of stacked spectra interactive use of the mouse to scale the LUT mouse-click on stacked spectra to provide monochromatic map move mouse over stacked spectra and track of monochromatic map in real-time mouse-click on stacked spectra to provide line plot of selected spectrum in separate window move mouse over stacked spectra and plot selected spectra in real-time
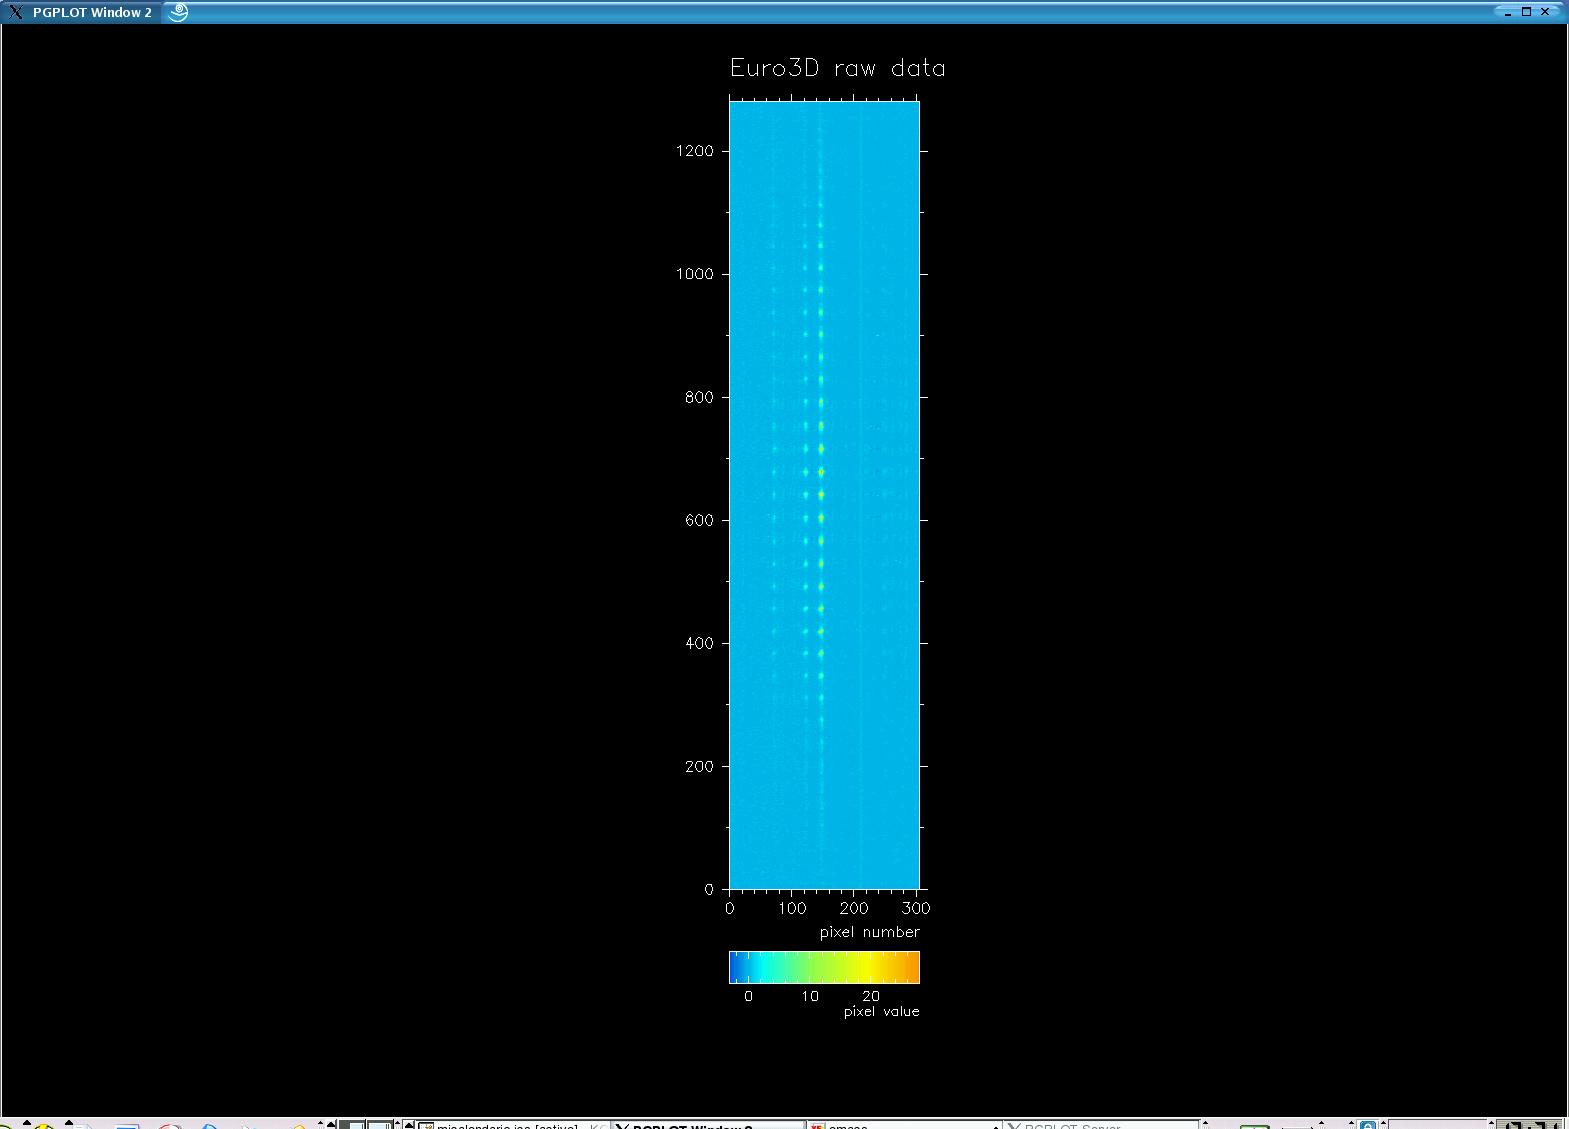 Fig. 8 |
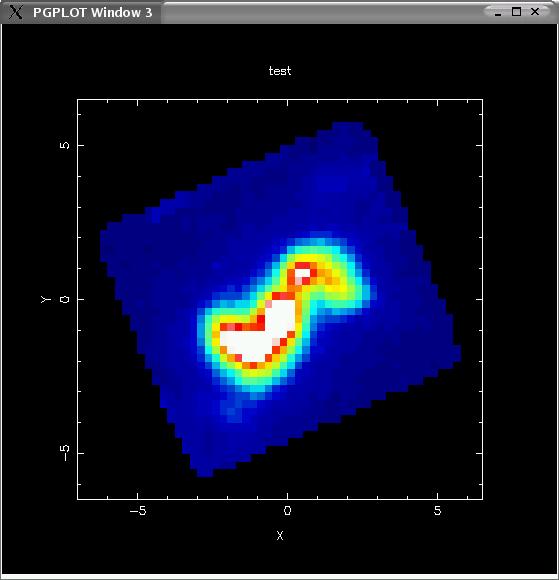 Fig. 9 |
 Fig. 10 |
 Fig. 11 |
Sebastian pointed out that depending on the type of instrument, there are cases with many spaxels and a small spectral range (typically TIGER-type IFUs), and others with relatively few spaxels but many spectral elements (e.g. PMAS). The format of the stacked spectra window, therefore, had to be adjusted accordingly. A scroll bar could help to provide a more convenient layout.
Finally, Sebastian demonstrated the capability of the prototype to handle datacubes of increasing size, using the previous PMAS datacube and concatenated multiples to simulate very large datacubes:
The demo included reading the data as stored in E3D Format and plotting maps with polygons, no matter if the polygon plot was meaningful or actually nonsense (for e.g. the MUSE case).4x PMAS = 1024 spaxels 16x PMAS = 4096 spaxels = 2/3 VIMOS @ 1024 spectral bins 64x PMAS = 16 K spaxels 360x PMAS = 92 K spaxels = MUSE
Result of this benchmark test:
In summary, even the early prototype, which is based on the preliminary Lyon Library with no optimization whatsoever, is capable of handling VIMOS-sized datacubes in no time.4x PMAS (1024) --- instant operation, very fast 16x PMAS (4096) --- somewhat slower, but still pretty fast 64x PMAS (16 K) --- noticeable read time (30sec), plotting slow 360x PMAS ( 92 K) --- read time ~7min, plotting very slow
For the time being, the MUSE size was out of the question. Arlette commented, however, that the slow read process for the 360x case should not be taken too seriously. Considering the fact that the GIPSY demo had been easily capable of reading a data cube of comparable size, is was reasonable to assume that by time-optimizing the I/O large gains could be accomplished. Further tests are in order to check also the effect of swapping which might have slowed down the computer used for the test. Finally, it was obviously neither advantageous nor necessary to use the polygon plot option for the MUSE simulation.
Martin concluded the demo sessions with thanks to everyone for their presentations and the statement, that the progress so far had been impressive and very encouraging.
There should be basically 3 windows:
Matthew remarked that for SPIFFI there was no need for the stacked spectra representation. There was a discussion whether or not the stacked spectra representation was really necessary. Taking into account IFUs with very many spaxels, the stacked spectra representation would soon become impractical. Sebastian pointed out that it was not really necessary to plot all stacked spectra at the same time, and a sensible subset could do as well. Martin proposed to define a region of interest based on a contiguous region in a map, to be taken as selection criterion for such a subset of stacked spectra. One could also consider to make the stacked spectra plot region optional. Marc reminded everyone of the difference in inspection and analysis tasks, which both would have to be performed by the vtool.Panel 0: stacked spectra window + menu Panel 1: image window (poly plot, image plot, overlay images, contours,) Panel 2: split spectra
Marc presented an interesting example of how to use a reordering scheme of stacked spectra according to position angle in the case of SPARSEPAK, allowing one to draw immediate conclusions about the orientation of the major kinematic angle of a galaxy by observing an emission line. This feature would require the presentation of stacked spectra with a user-defined ordering scheme.
Pierre requested a scripting capability. This feature should be generic
and planned in the very beginning, otherwise it would become very difficult
to include it at a later stage of the project.
Philosophy:
Basic Requirements:
Status Data Format Document:
goal of release until Feb 28
Status C Library:
goal of release of alpha Version until Feb 28
DEMOs:
Demo Thomas (MONOLOOK, PMAS polygon + effect of refraction)
Demo Marc (GIPSY): image oriented
Demo Prototype Sebastian
Proposal:
- basic window of all stacked spectra with menu, from which one defines
wavelength or wavelength region
- image window, displaying monochromatic/broadband polygon plot (or
image)
- spectra window, showing stacked spectra (or SOI) plus line plot of
spectrum (intensity vs. lambda)
- extra window for position-intensity plots (pseudo longslit)
Markus agreed essentially on the proposed items and thought that the link between spatial and spectral representations in two directions was a good idea.
The E3D data format was discussed next. Providing Version 1.0 of the Data Format Document until the end of February should in principle be possible, despite heavy work on Paranal. The remaining work was essentially concerned with writing up meaningful examples. Markus would work on the draft, eventually passing it over to the task force.
There was a discussion about the possibility of storing vectors with different lengths. Markus was wondering whether this variant incurs the necessity of pointers, pointing down to heap area at the end of file.
Arlette explained that according to the cfitsio library, there were
2 ways to handle this problem:
(1) heap (discouraged)
(2) specify columns as wide a possible, no heap (preferred)
Option (2) is more favourable because it is much easier for the coding. Pierre added that "cropping" was longer necessary, by specifying START, STEP each spectrum would be uniquely mapped into the assigned spectral range.
Sebastian recalled that a keyword for relative humidity was lacking
in the group table.
He also requested that the unit of SIZE should be forced to be identical
to the one used for the position table. This needed to be spelled out explicitely
in the text of the document.
Arlette asked whether there was a convention for the identification of SHAPE.
Markus was inquiring whether or not the PGPLOT library was suitable, and how it compares with GIPSY. Sebastian explained that GIPSY was essentially based on PGPLOT, so there was no question that the library would be a good choice.
Marc added for the pseudo-longslit representation that it could easily be extended to any non-linear form.
Further comments by Markus:
Marc thought that the latter task involved an enormously large number
of tasks and was probably not doable within the project . A logical way
out was to export data e.g. with FITS, and then use one's favourite image
processing programme for further analysis.
Marc said that within the GIPSY group, this problem had created a large overhead of learning how to communicate with Tcl/Tk, but after implementation there had been a huge reward, and he recommended to ask these people about their experience.
The following discussion was concerned with communication between Tcl/Tk and pgplot, the possible use of X events, and shared memory access for interchange of data between the vtool and other programmes.
Arlette volunteered to look into this, and to provide a special chapter for specification document, discussing the interface between PGPLOT and Tcl/Tk
In the end, Marc proposed to consider an additional dimension for 3D spectro-polarimetry. Martin applauded this idea as an actually real perspective since there is a polarimetry upgrade being discussed for PMAS.
At 18:55 (local) the telecon and the first day of the meeting were closed.
Day 2
Martin remembered that at the Marseille meeting there had been a decision, identifying PYTHON and IDL as the supported command interpreter languages.
Arlette said that shared memory would be a simple solution to link IDL or any other UNIX programme to the vtool (and other Euro3D software). There are C programmes supporting shared memory allocation (shm_put, shm_get) and a mechanism of locating memory with identifiers/lables. For example, saoimage is also supporting this mechanism. This means that any external data analysis programme can access data cubes and derived data sets like maps, selected or co-added spectra etc. through shared memory. Shared memory access would also make Euro3D software more useful for others, e.g. Pearl, PYTHON, PyRAF, IDL, etc.
DECISION: it was agreed that we seek to provide shared memory access as communication interface, but tests are needed
Arlette made the point that the Euro3D software developments should be open for future use, and as general as possible.
DECISION: it was agreed that priority should be given for an open development and sound design on the expense of pretty features
Matthew proposed to investigate whether there are ways to use the XPA
library (same group that developed DS9). It supports shared memory access
(xpaget,xpaset) and includes socket communication etc.
Marco reported an earlier test with a VMOS datacube, using the old version dataformat, which was able to load the file in no time. He was questioning whether or not the bintable would slow down the reading.the present prototype was able to handle the data and did not crash it was not really possible to load the file (excessive load time, perhaps an error in C library) plotting was slow because of poly_plot (which is not what is in reality required for MUSE)
ACTION (Arlette) check whether revised data format incurs slower reading 28-Feb-2003
Marc said that radio data was usually split into several files,
and also coming in a compressed format.
ACTION (ssa) Test
shared memory
28-Feb-2003
ACTION (ssa) Test
integration in TK environment
28-Feb-2003
Since the programming work had been started, the software repository should be set up at the AIP webserver.
ACTION (Petra) setup repository and provide access from the outside world 30-Apr-2003
Marco volunteered to investigate shared memory access under PYTHON/PyRAF
ACTION (Marco) investigate PYTHON/PyRAF shared memory access
Pierre: Bruno Jungwiert will start to work on interface problems for
GUI of line fitting tool, by June should
be ready to provide some information - goals are close to vtool.
For the continuation of the work, it was agreed to share information through extensive use of the existing email lists.
ACTION (mmr) include
Marc in vtool email list
ASAP
Priorities of basic requirements :
(1) select map from stacked spectra representation
(1.1) display monochromatic spaxel image (slice)
(1.2) display broadband spaxel imaging (co-added slices)
(1.3 ) interpolate spaxel and create image
(1.4) page handling, blinking
(1.5) display map (interpolated spaxel image)
(1.6) display map with overlay of spaxel shape
(1.7) correct for atmospheric refraction
(1.8) display map with atm. refraction correction
(1.9) weighed coadded map (exlude noisy spaxels)
(1.10 ) load FITS
(1.11) simple statistics
(2) select spectra from map representation
(2.1) investigate interaction between windows, events
(2.2) Window Layout
(3) alternative representations
(3.1) pseudo long-slit
Marc volunteered to provide input for the vtool layout and functionality
ACTION (Marc) supply SPARSEPAK sample data
ACTION (Sebastian) provide translator for SPARSEPAK to E3D
ACTION (Marco) provide plan for tasks to be done by Sebastien Faucault
ACTION (Sebastian,Martin) vtool prepare specification document
ACTION (Matthew) provide list of vtool
requirements from mosaic task 01-Jun-2003
Markus called for the second telecon of the meeting at 14:00 (local Potsdam)
It was unanimously agreed to use shared memory as interface, if technically feasible. A decision should be made as a matter of priority. Markus also reminded the team to not forget simple statistics tools.
There was a suggestion to start experimenting with VMOS IFU data. Markus reported that there had been science verification observations in January, and he would be willing to try and make the results available to the RTN. These first observations included 1600 IFU spectra, but for the end of February observations with the 6400 fiber configuration would be anticipated.
Martin reported that the RTN Science Workshop in Cambridge at been agreed with Ian Parry to take place on May 21-23.
End of telecon: 14:30.
Summary of Milestones and Action Items :
Milestones:
| (1) | Release Lyon C Library, alpha Version | 28-Feb-2003 |
| (2) | Release Data Format Document Version 1.0 | 28-Feb-2003 |
| (3) | Test Report Python/PyRAF (Marco) | 31-Mar-2003 |
| (4) | Test Report XPA (Matthew) | 31-Mar-2003 |
| (5) | Test Report IDL (Martin) | 31-Mar-2003 |
| (6) | Decision about interface: | 31-Mar-2003 |
| (7) | Visualization Tool Specification Document 1st Draft | 31-Mar-2003 |
| (8) | Visualization Tool Prototype | 30-Apr-2003 |
| goal: present prototype for testing at Science Workshop | ||
| (9) | Visualization Tool Specification Document Distribution | 21-May-2003 |
| (10) | Science Workshop Cambridge | 21-May-2003 |
| (10) | LYON Mini-workshop Line Fitting Tool + Deconvolution | ??-Sep-2003 |
| (11) | Visualization Tool Version 1.0 | 30-Nov-2003 |
Action Items:
| ACTION (Arlette) | check whether revised data format incurs slower reading | 28-Feb-2003 |
| ACTION (ssa) | Test shared memory | 28-Feb-2003 |
| ACTION (ssa) | Test integration in TK environment | 28-Feb-2003 |
| ACTION (Petra) | setup repository and provide access from the outside world | 30-Apr-2003 |
| ACTION (Marco) | investigate PYTHON/PyRAF shared memory access | ??? |
| ACTION (mmr) | include Marc in vtool email list | ASAP |
| ACTION (Marc) | supply SPARSEPAK sample data | ??? |
| ACTION (Sebastian) | provide translator for SPARSEPAK to E3D | ??? |
| ACTION (Marco) | provide plan for tasks to be done by Sebastien Faucault | ??? |
| ACTION (Sebastian,Martin) | vtool prepare specification document | ??? |
| ACTION (Matthew) | provide list of vtool requirements from mosaic task | 01-Jun-2003 |
The meeting was closed at 16:30