A new method of inverting and analyzing spectropolarimetric observations
allows us to reconstruct 3-dimensional structures in the solar
photosphere. The inversion of spectro-polarimetric line profiles is based
on supervised machine learning algorithms i.e. artificial neural networks (ANN,
Carroll & Staude 2001)
and utilizes recent high-resolution, mixed-polarity magnetoconvection
simulations. The ANN based Zeeman-Tomography is being developed in the
stellar activity program
of the Astrophysical Institute Potsdam
and provides a unique opportunity
to incorporate the results of magnetohydrodynamic simulations into the
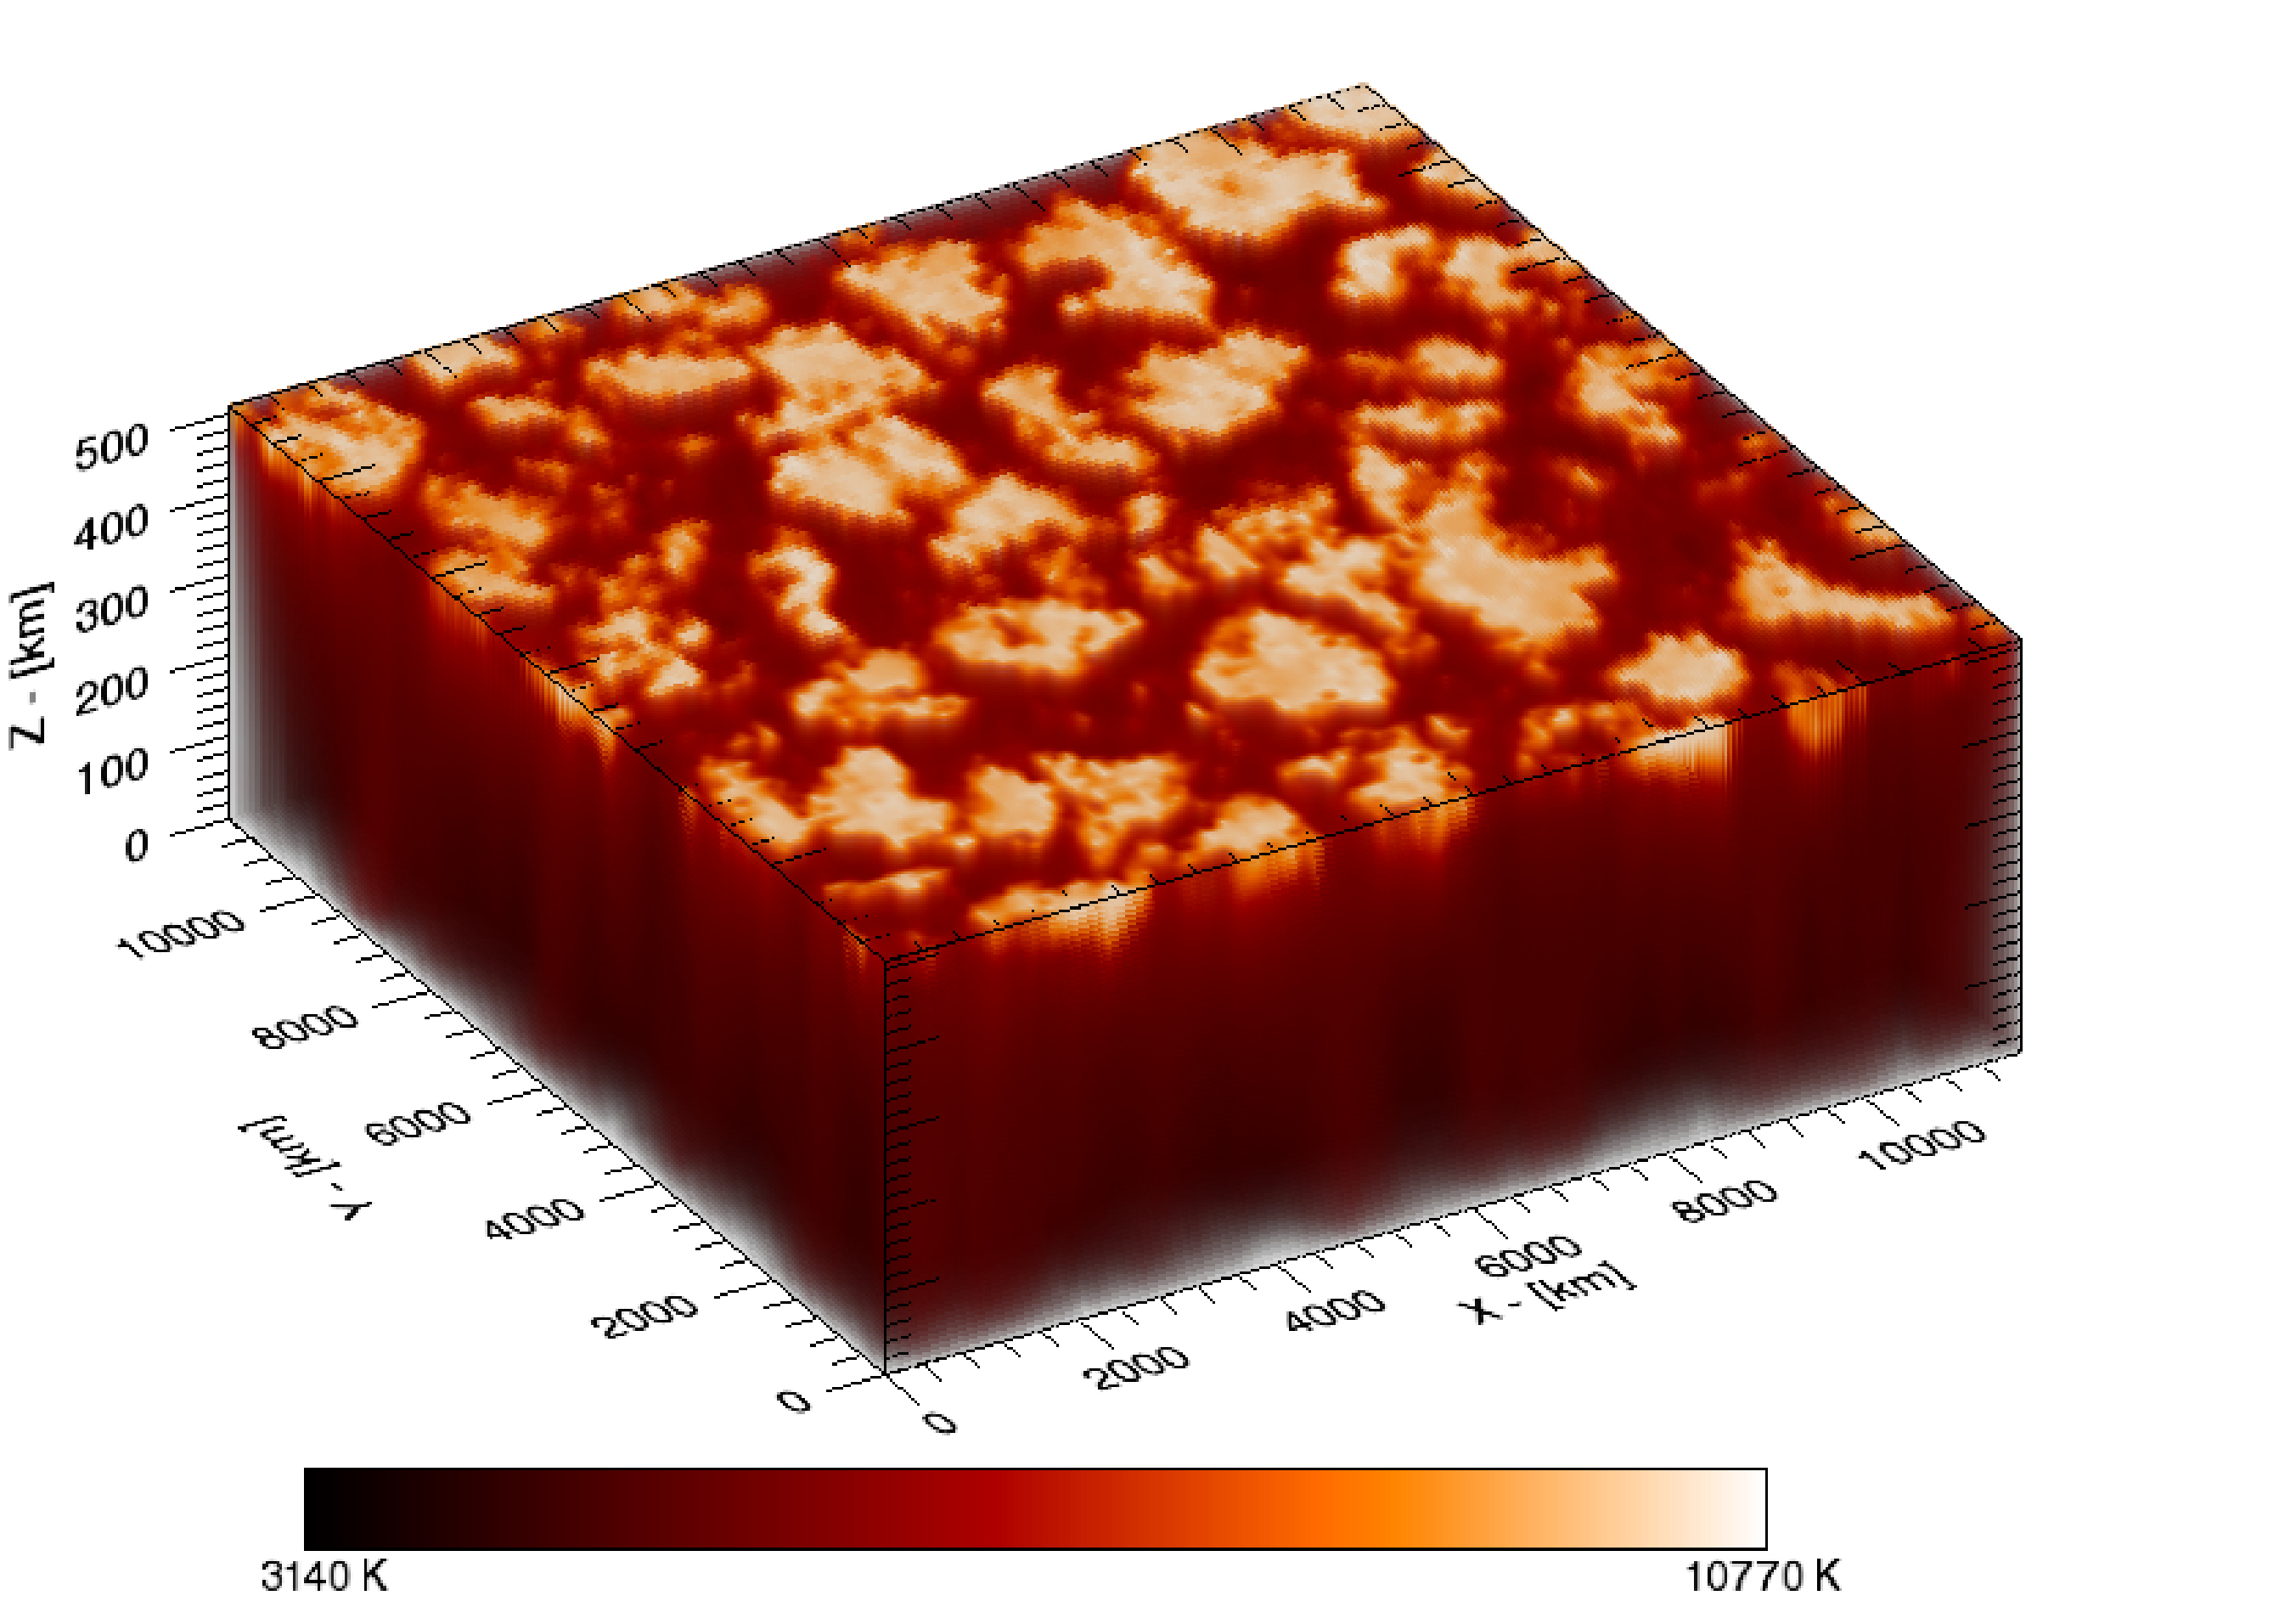
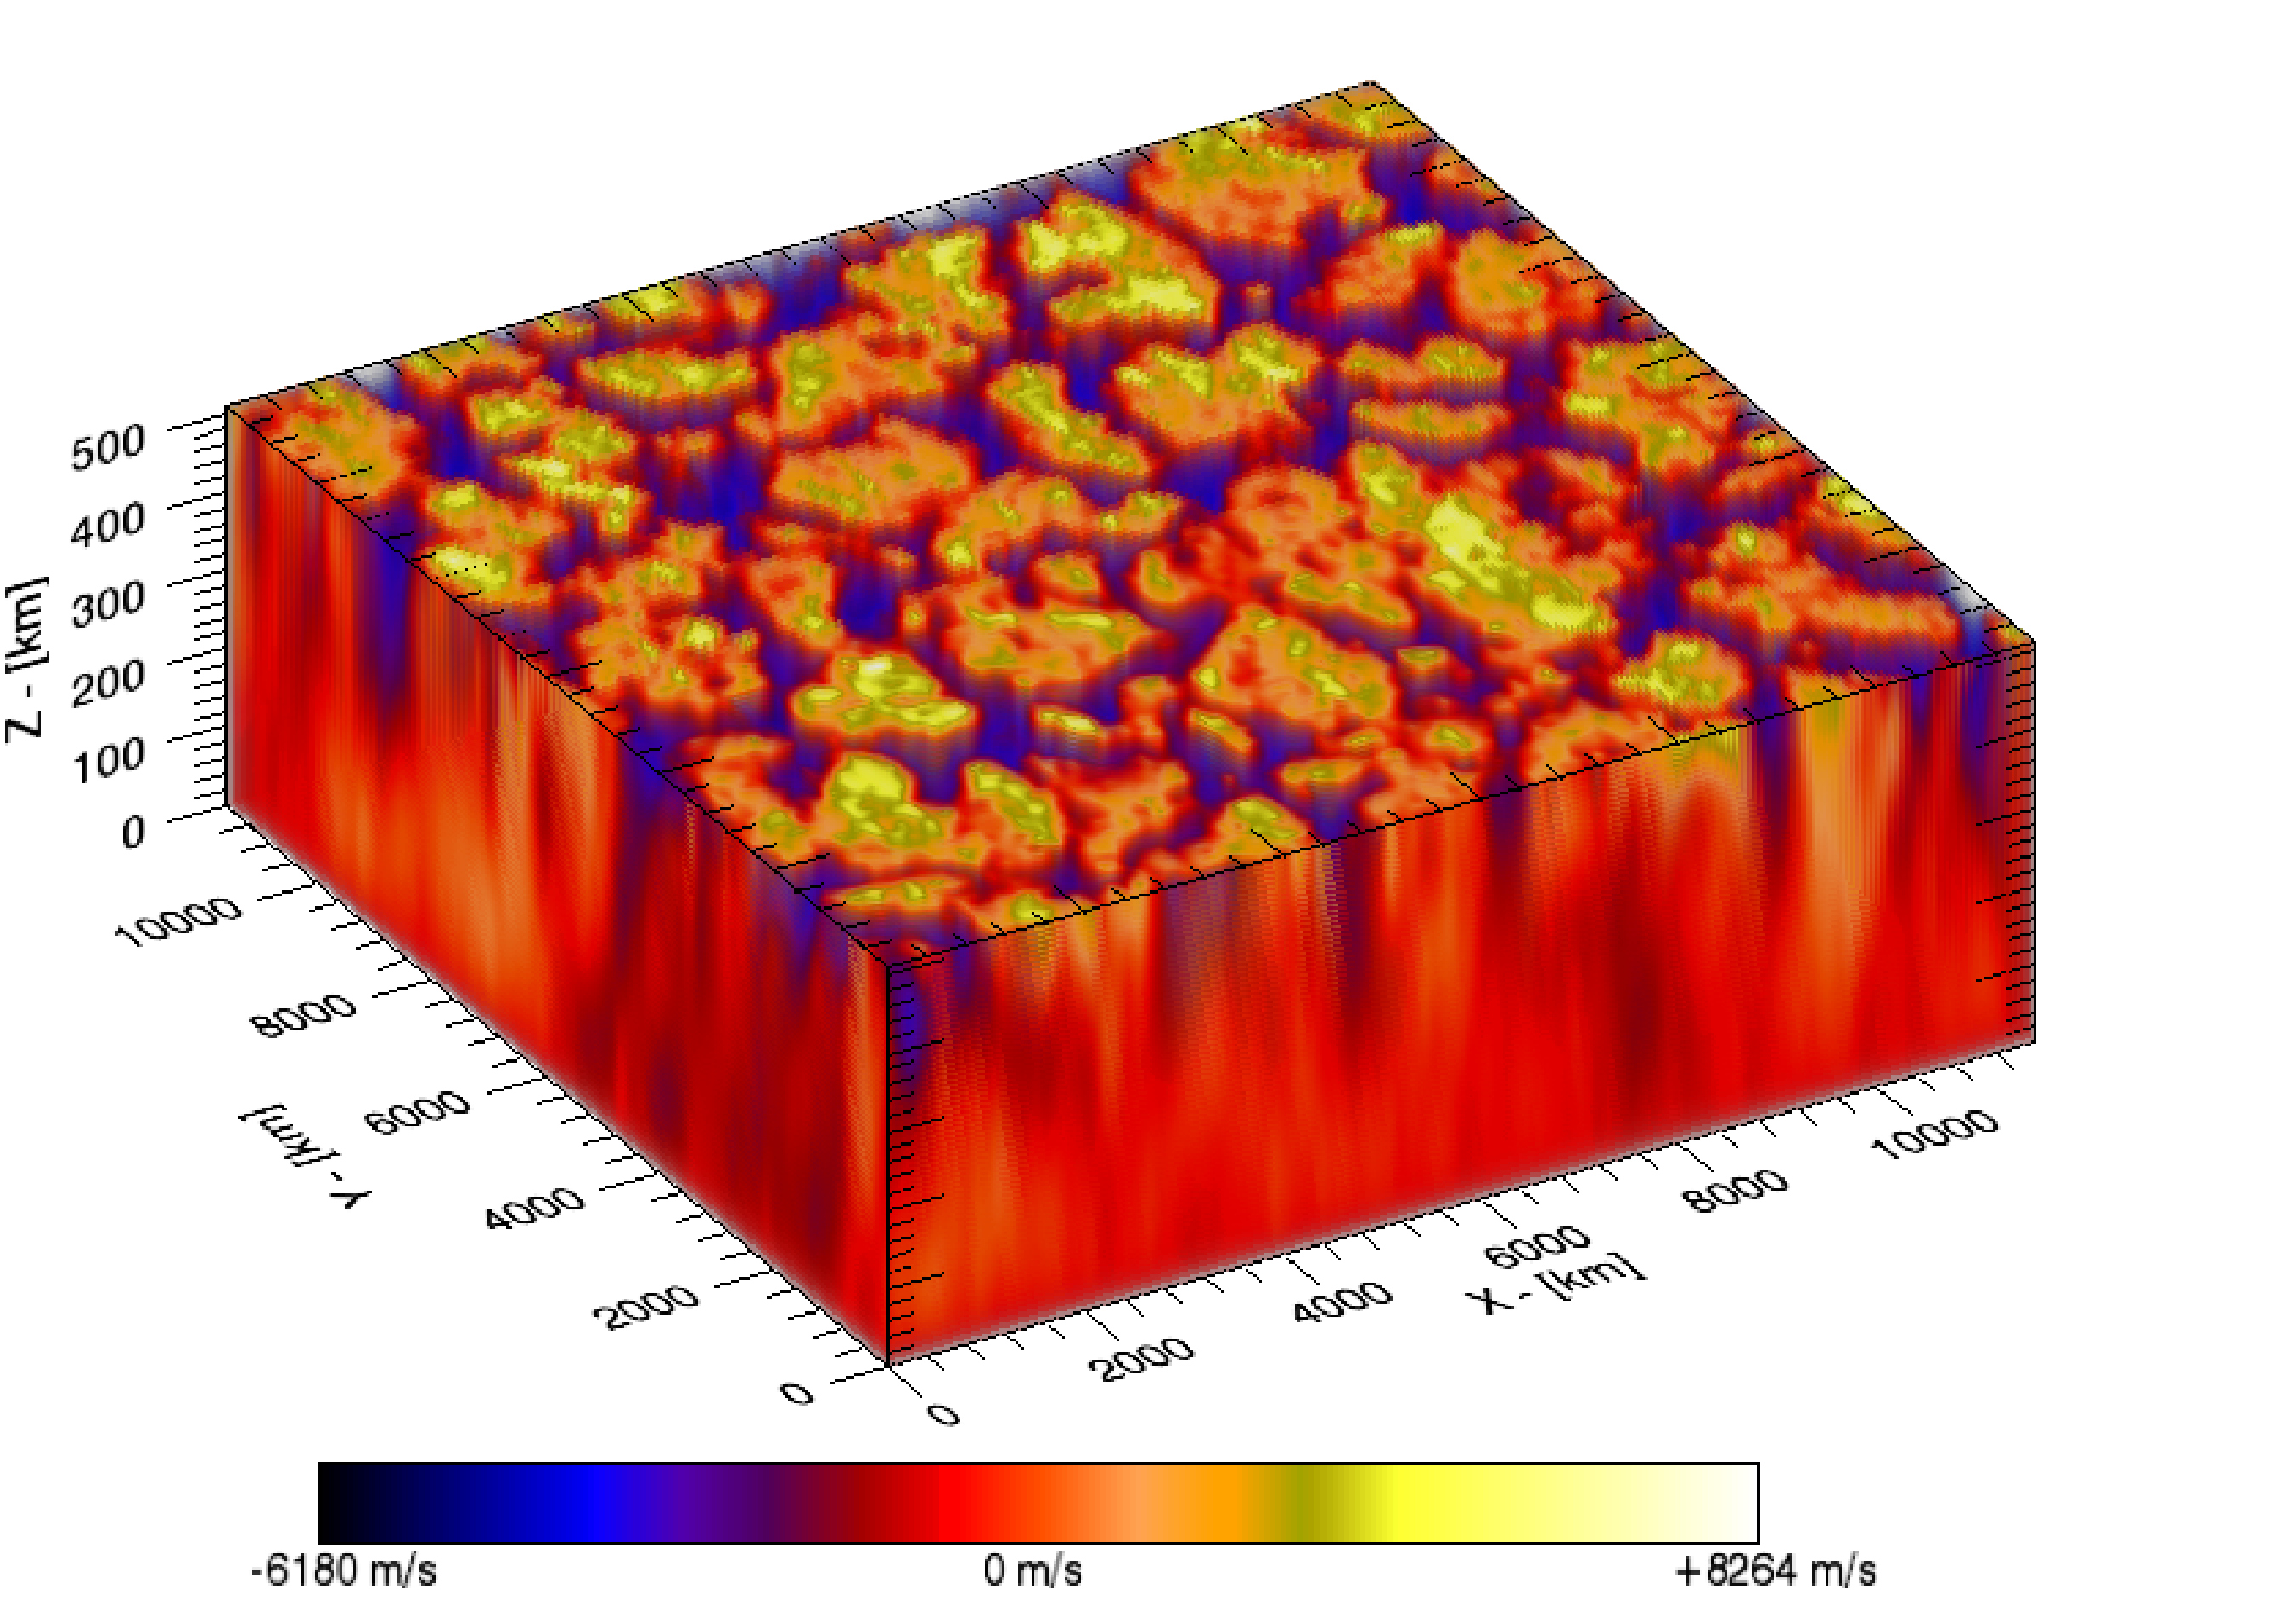
inversion process, and moreover allows us to infer the depth stratification
of various atmospheric quantities like the temperature, line-of-sight velocity,
and the line-of-sight magnetic field on a geometric height scale.
Having retrieved the run of these quantities on a common height scale
facilitates the subsequent combination of all individual stratifications to
obtain a complete 3-dimensional reconstruction (tomography)
of the atmospheric parameters. This is in contrast to conventional
magnetic flux maps or one-dimensional inversions that only allow to
estimate the magnetic field in one surface layer.
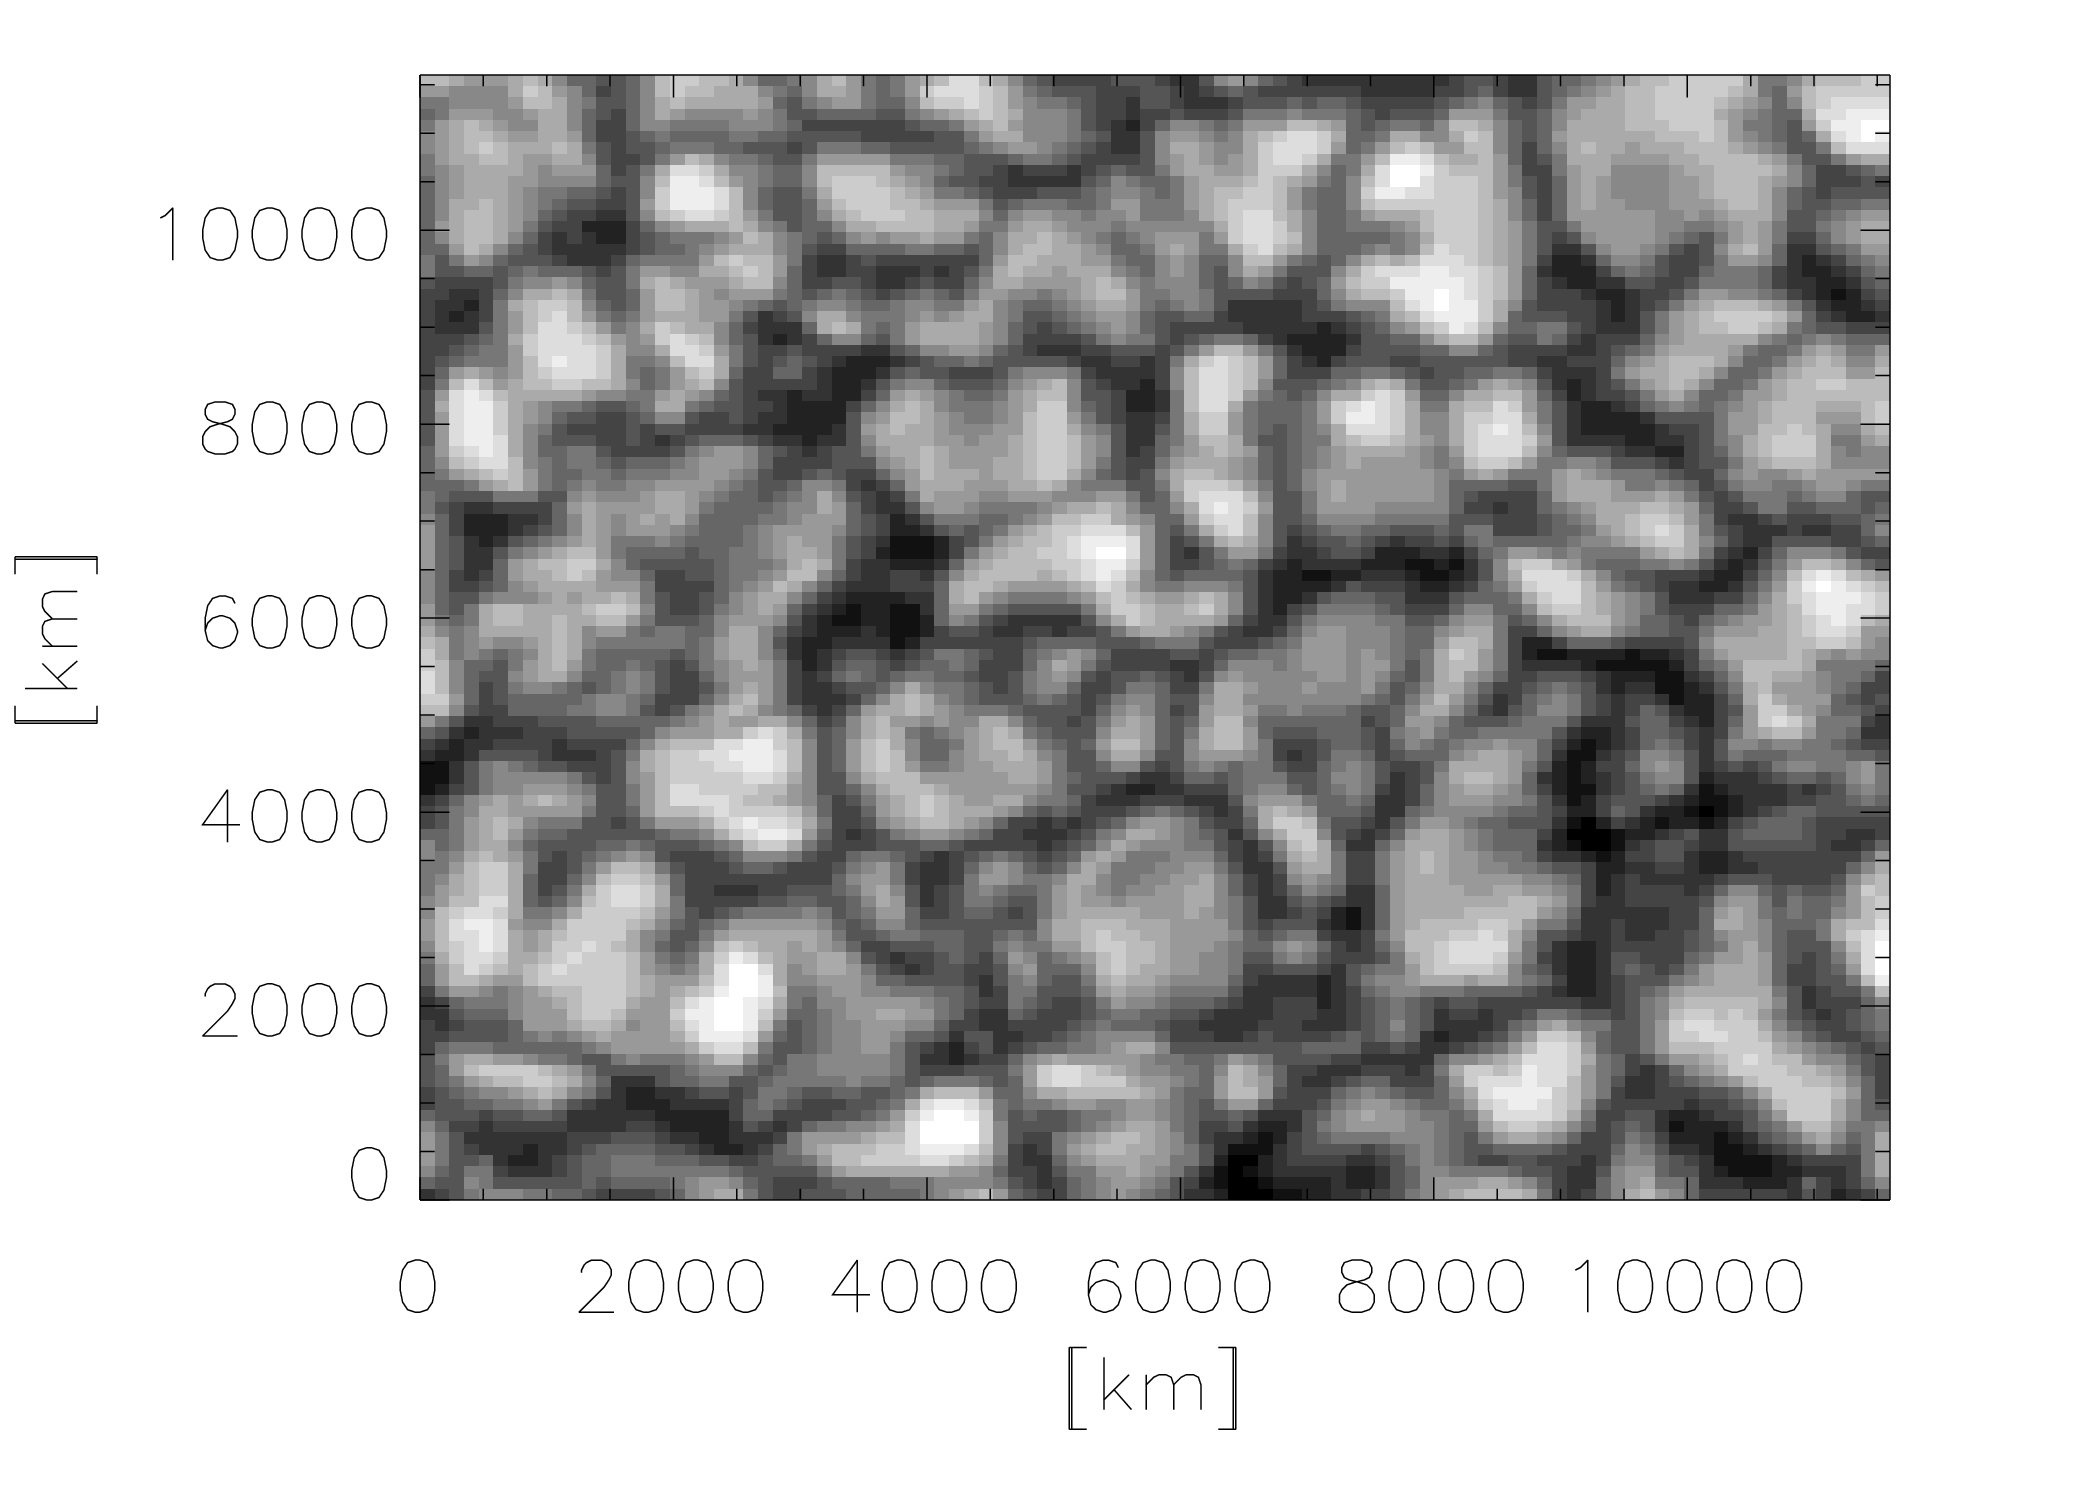
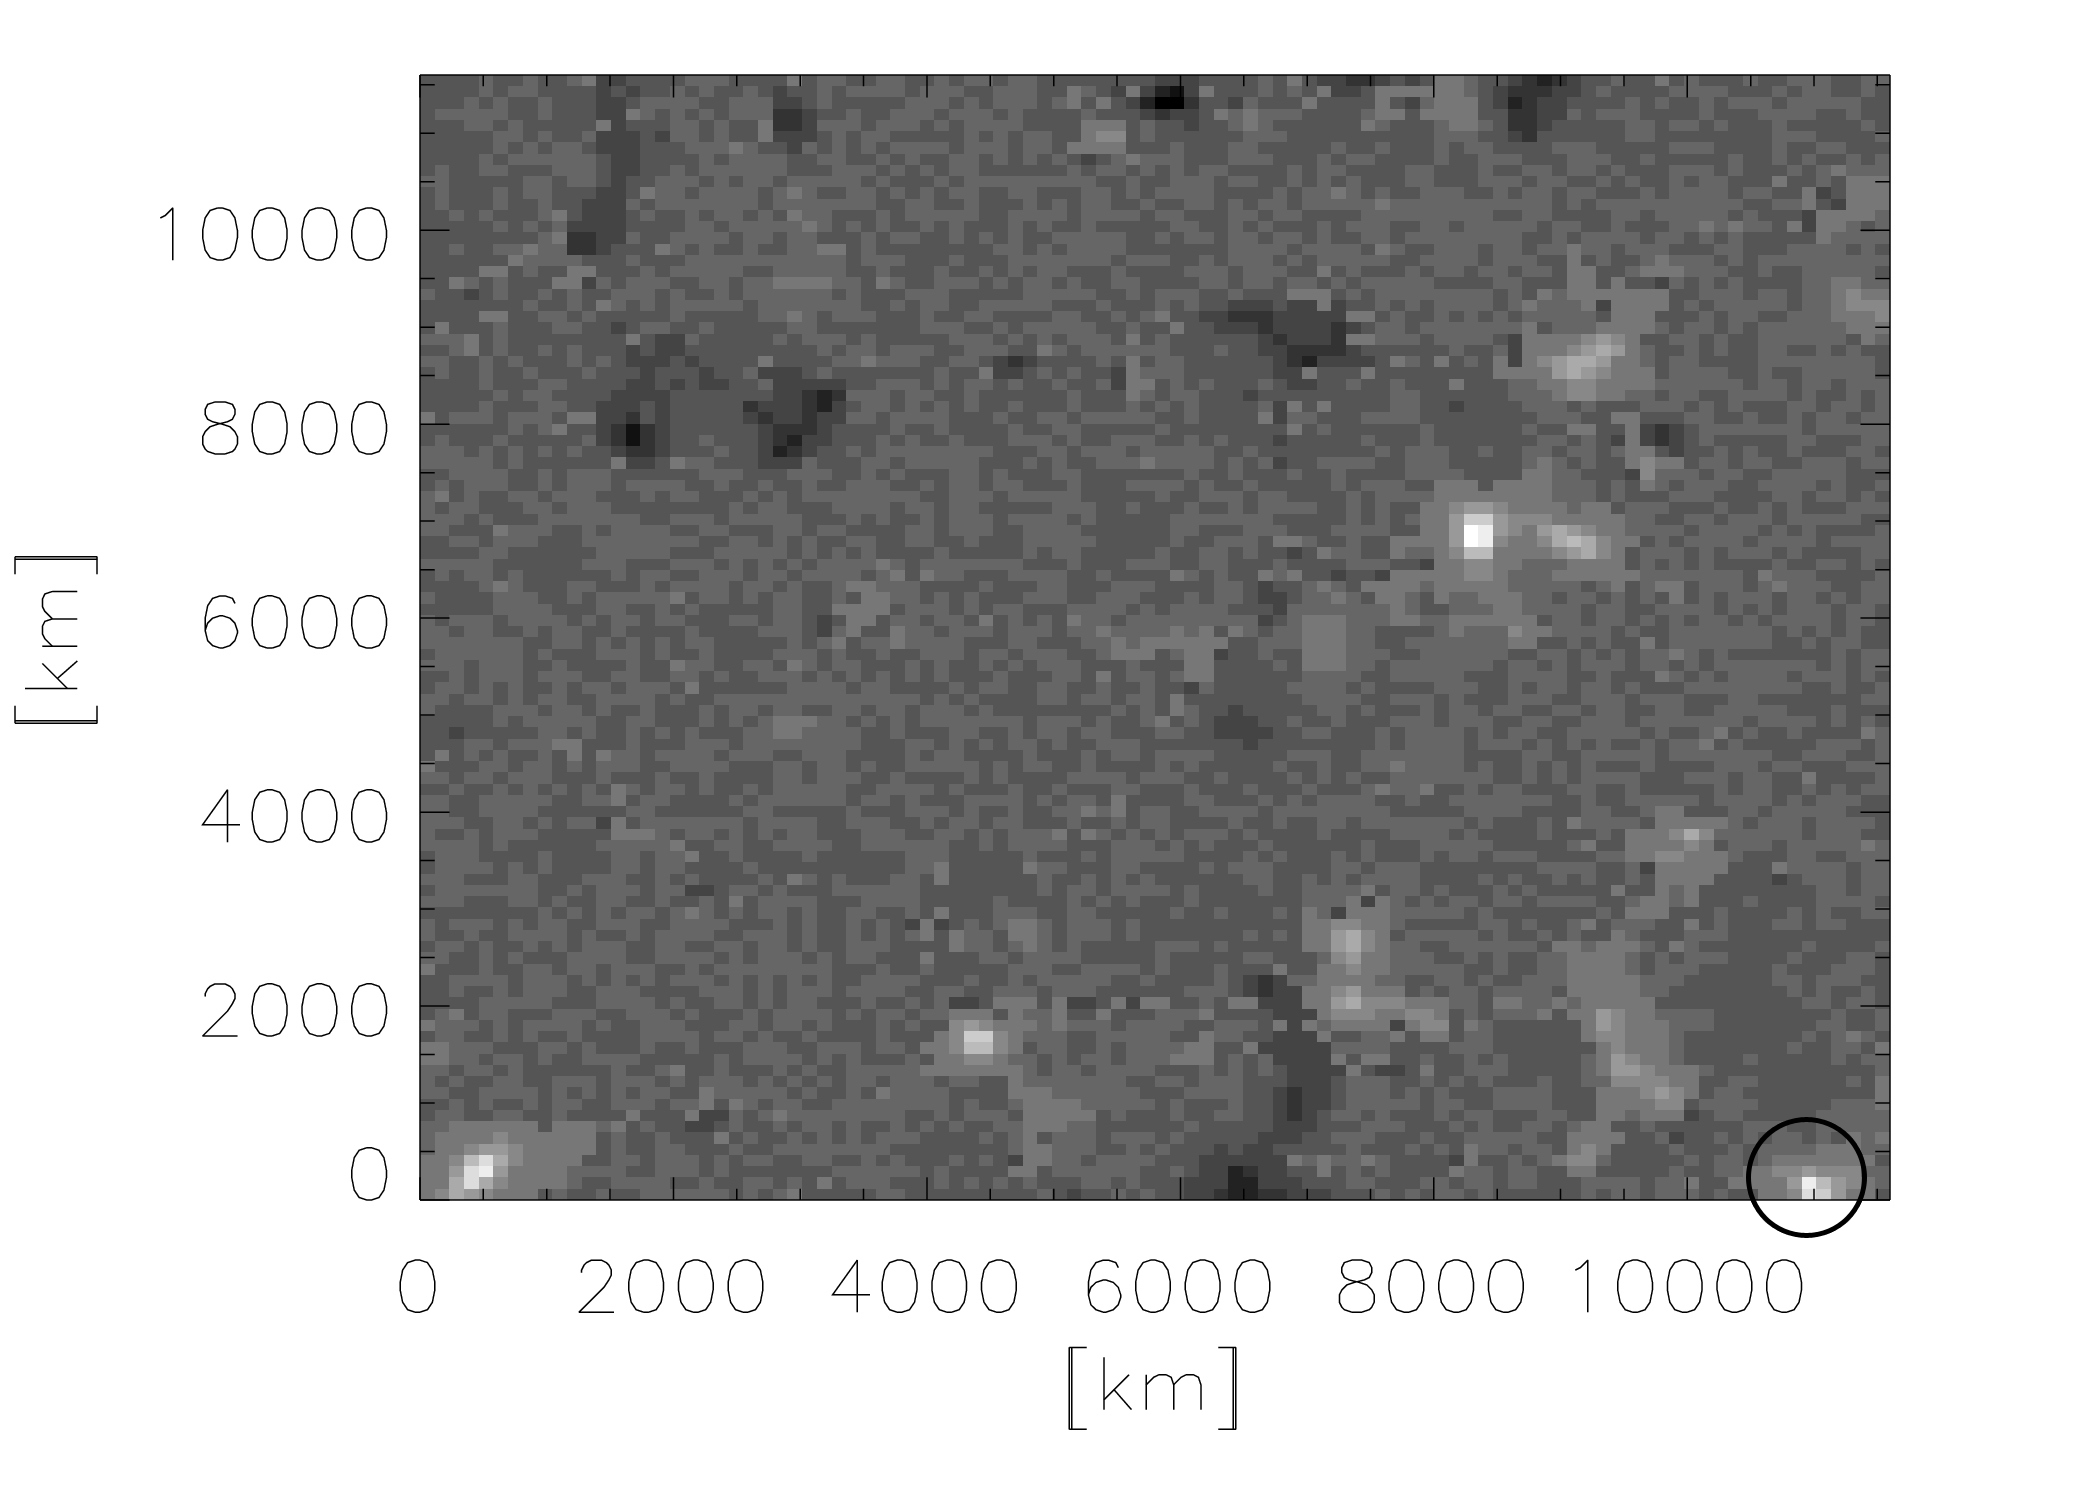
We have applied this technique to very recent spectropolarimetric
observations of a quiet solar region taken with the
Solar Optical Telescope (SOT) aboard the Hinode satellite.
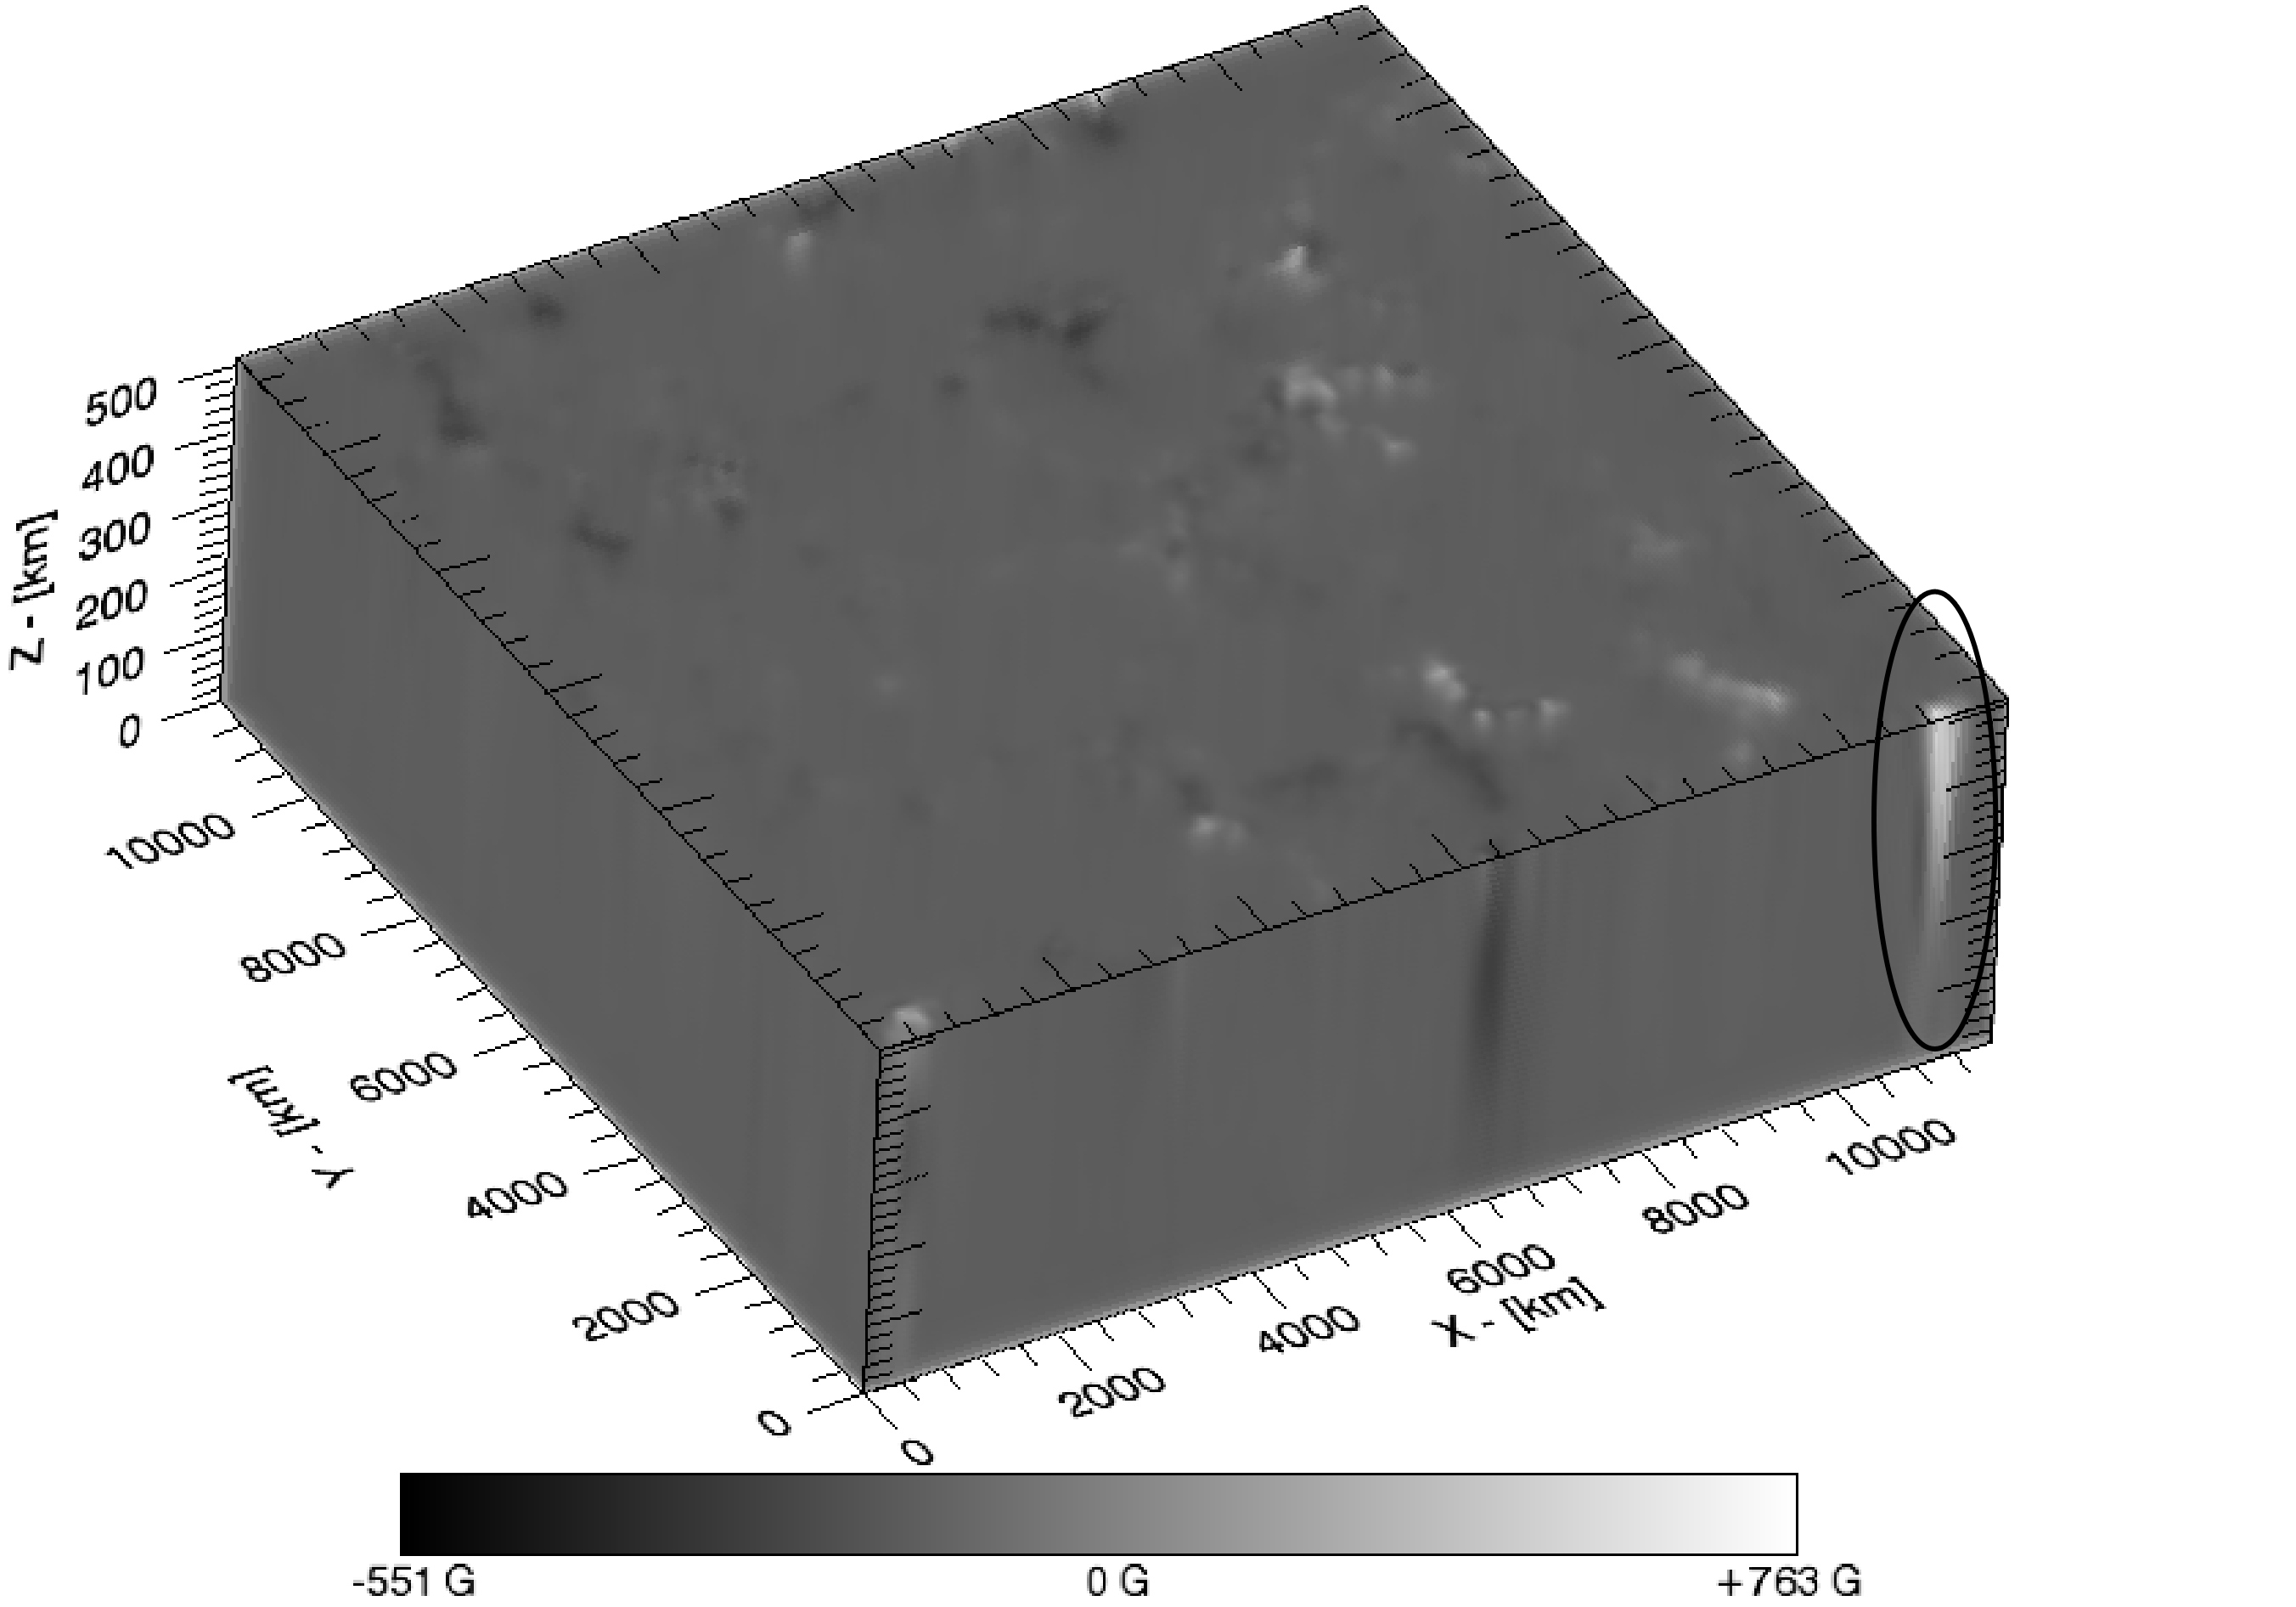
The 3-dimensional reconstruction is made for a photospheric surface
layer of 500 km in height and a field of view of 12,000 by 12,000 km.
Each reconstructed volume, for the temperature, velocity and magnetic field,
consists of 370,000 individual data points.
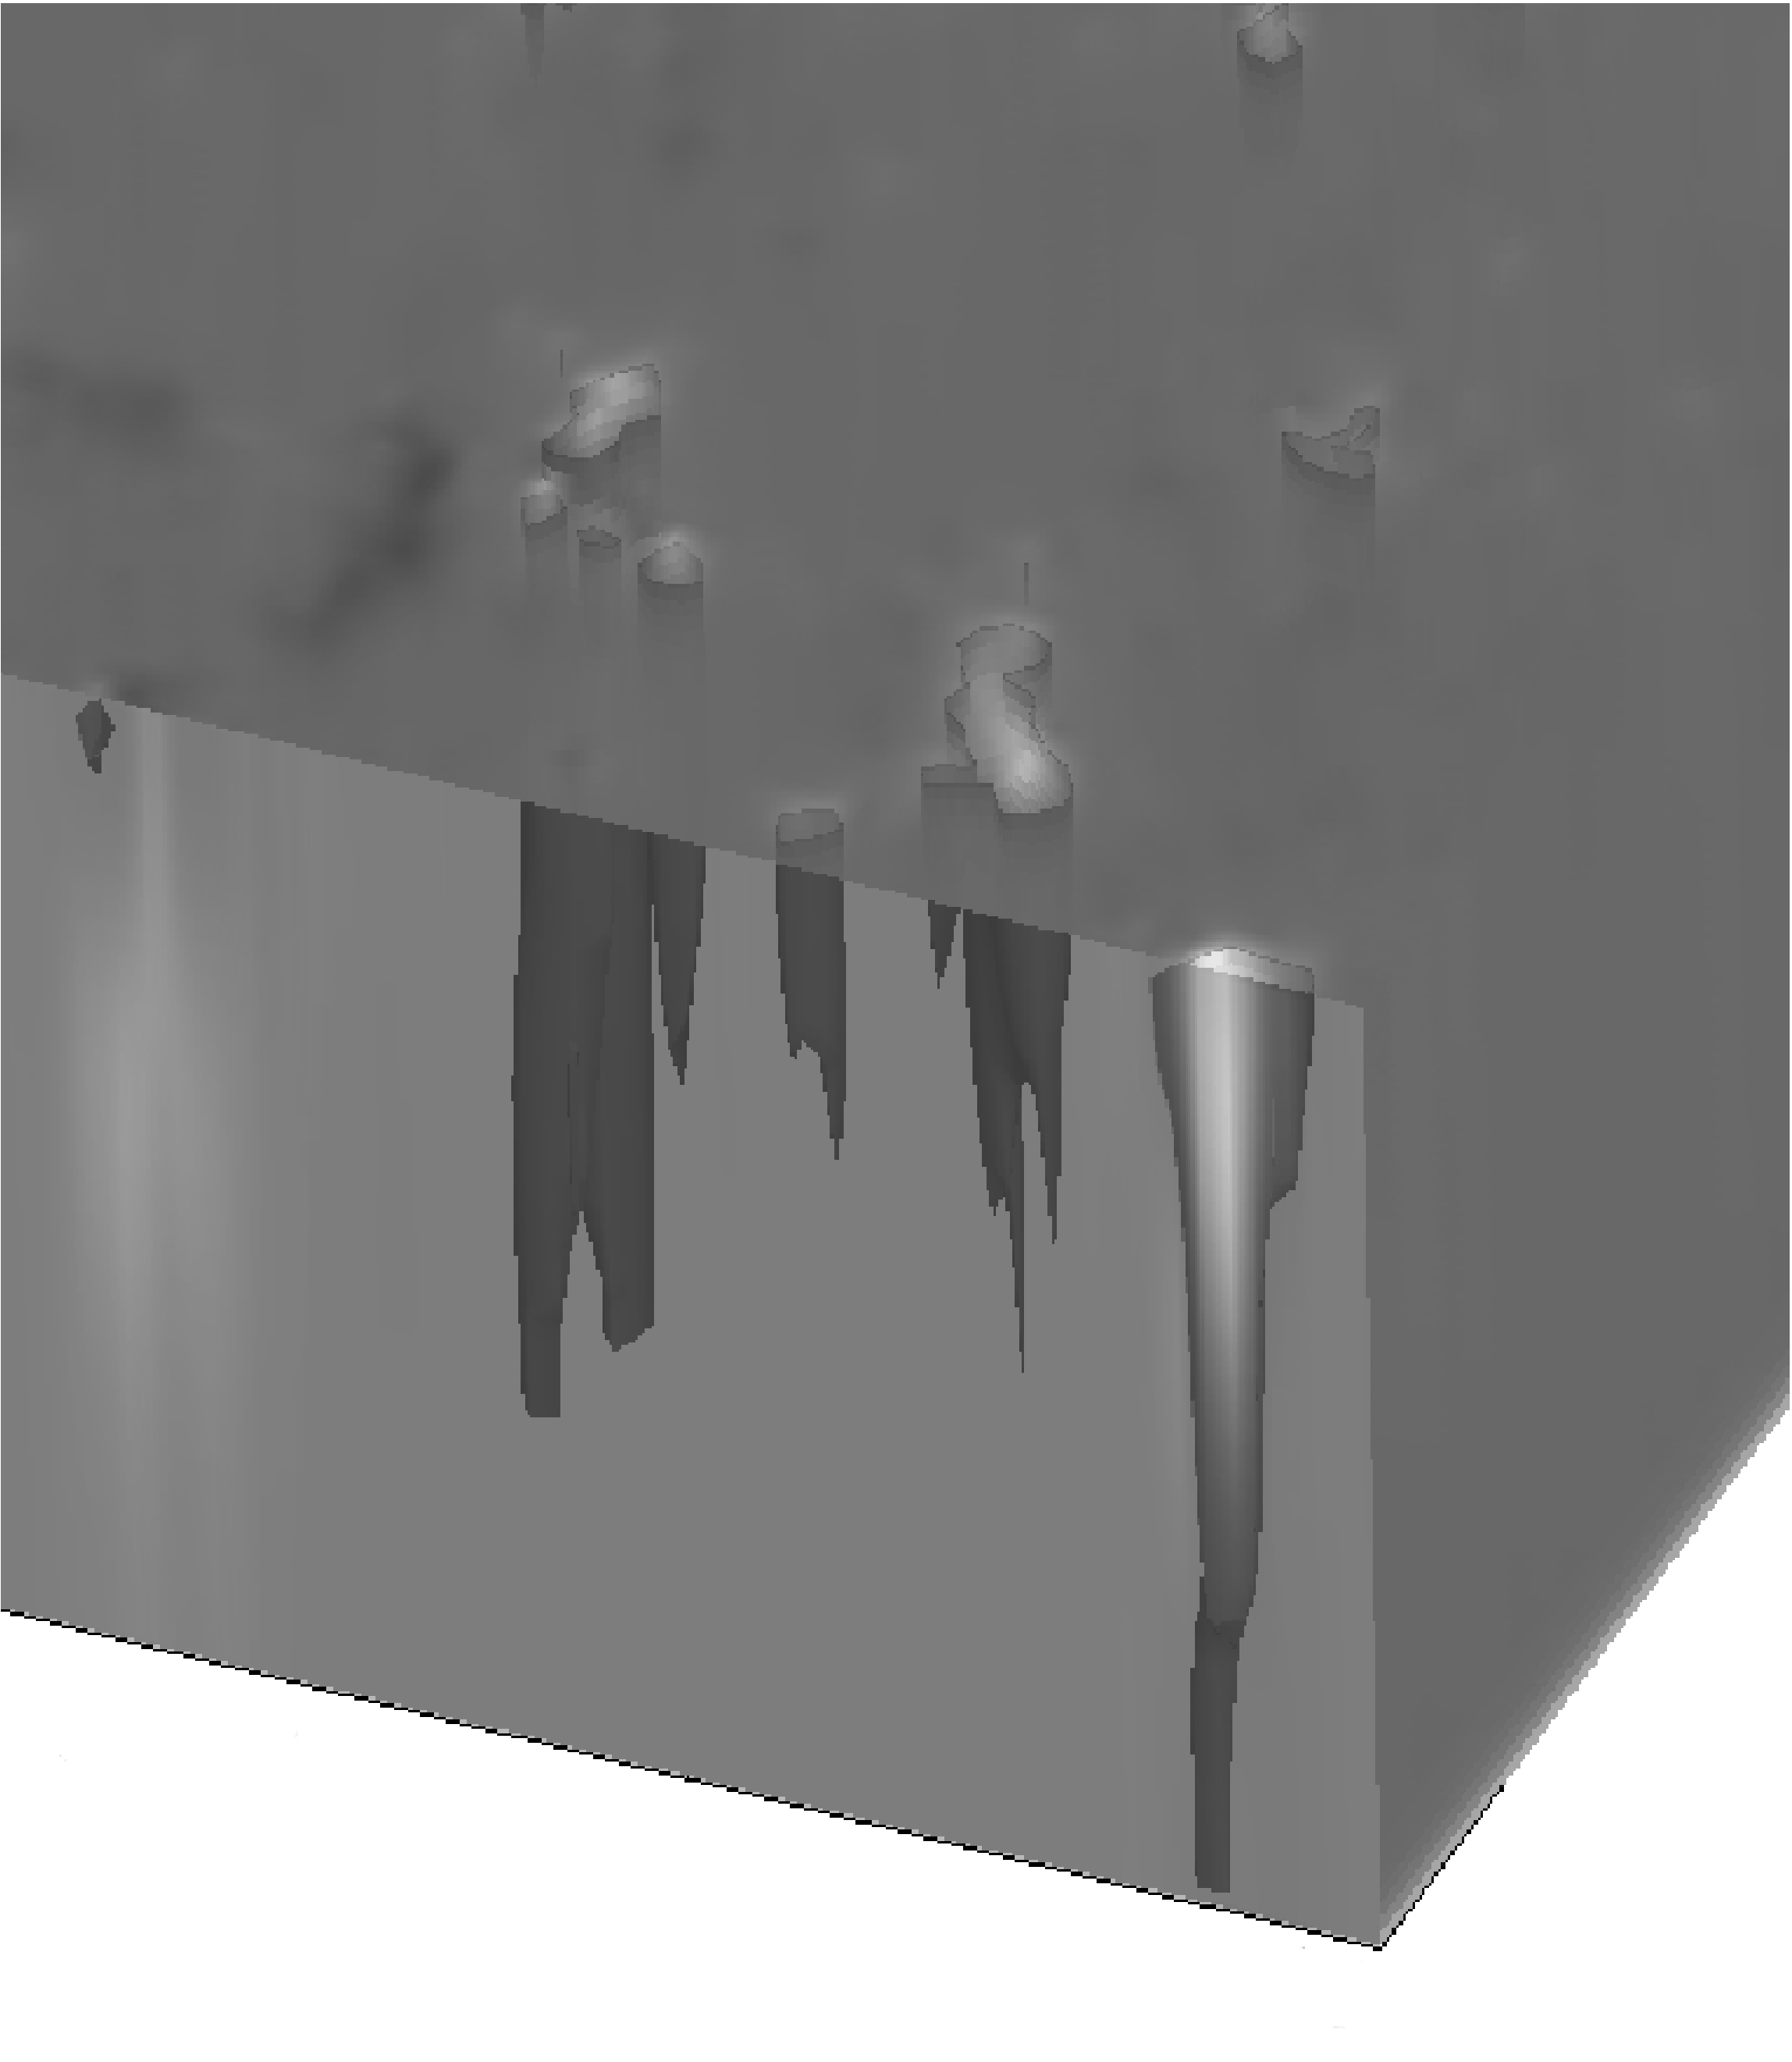
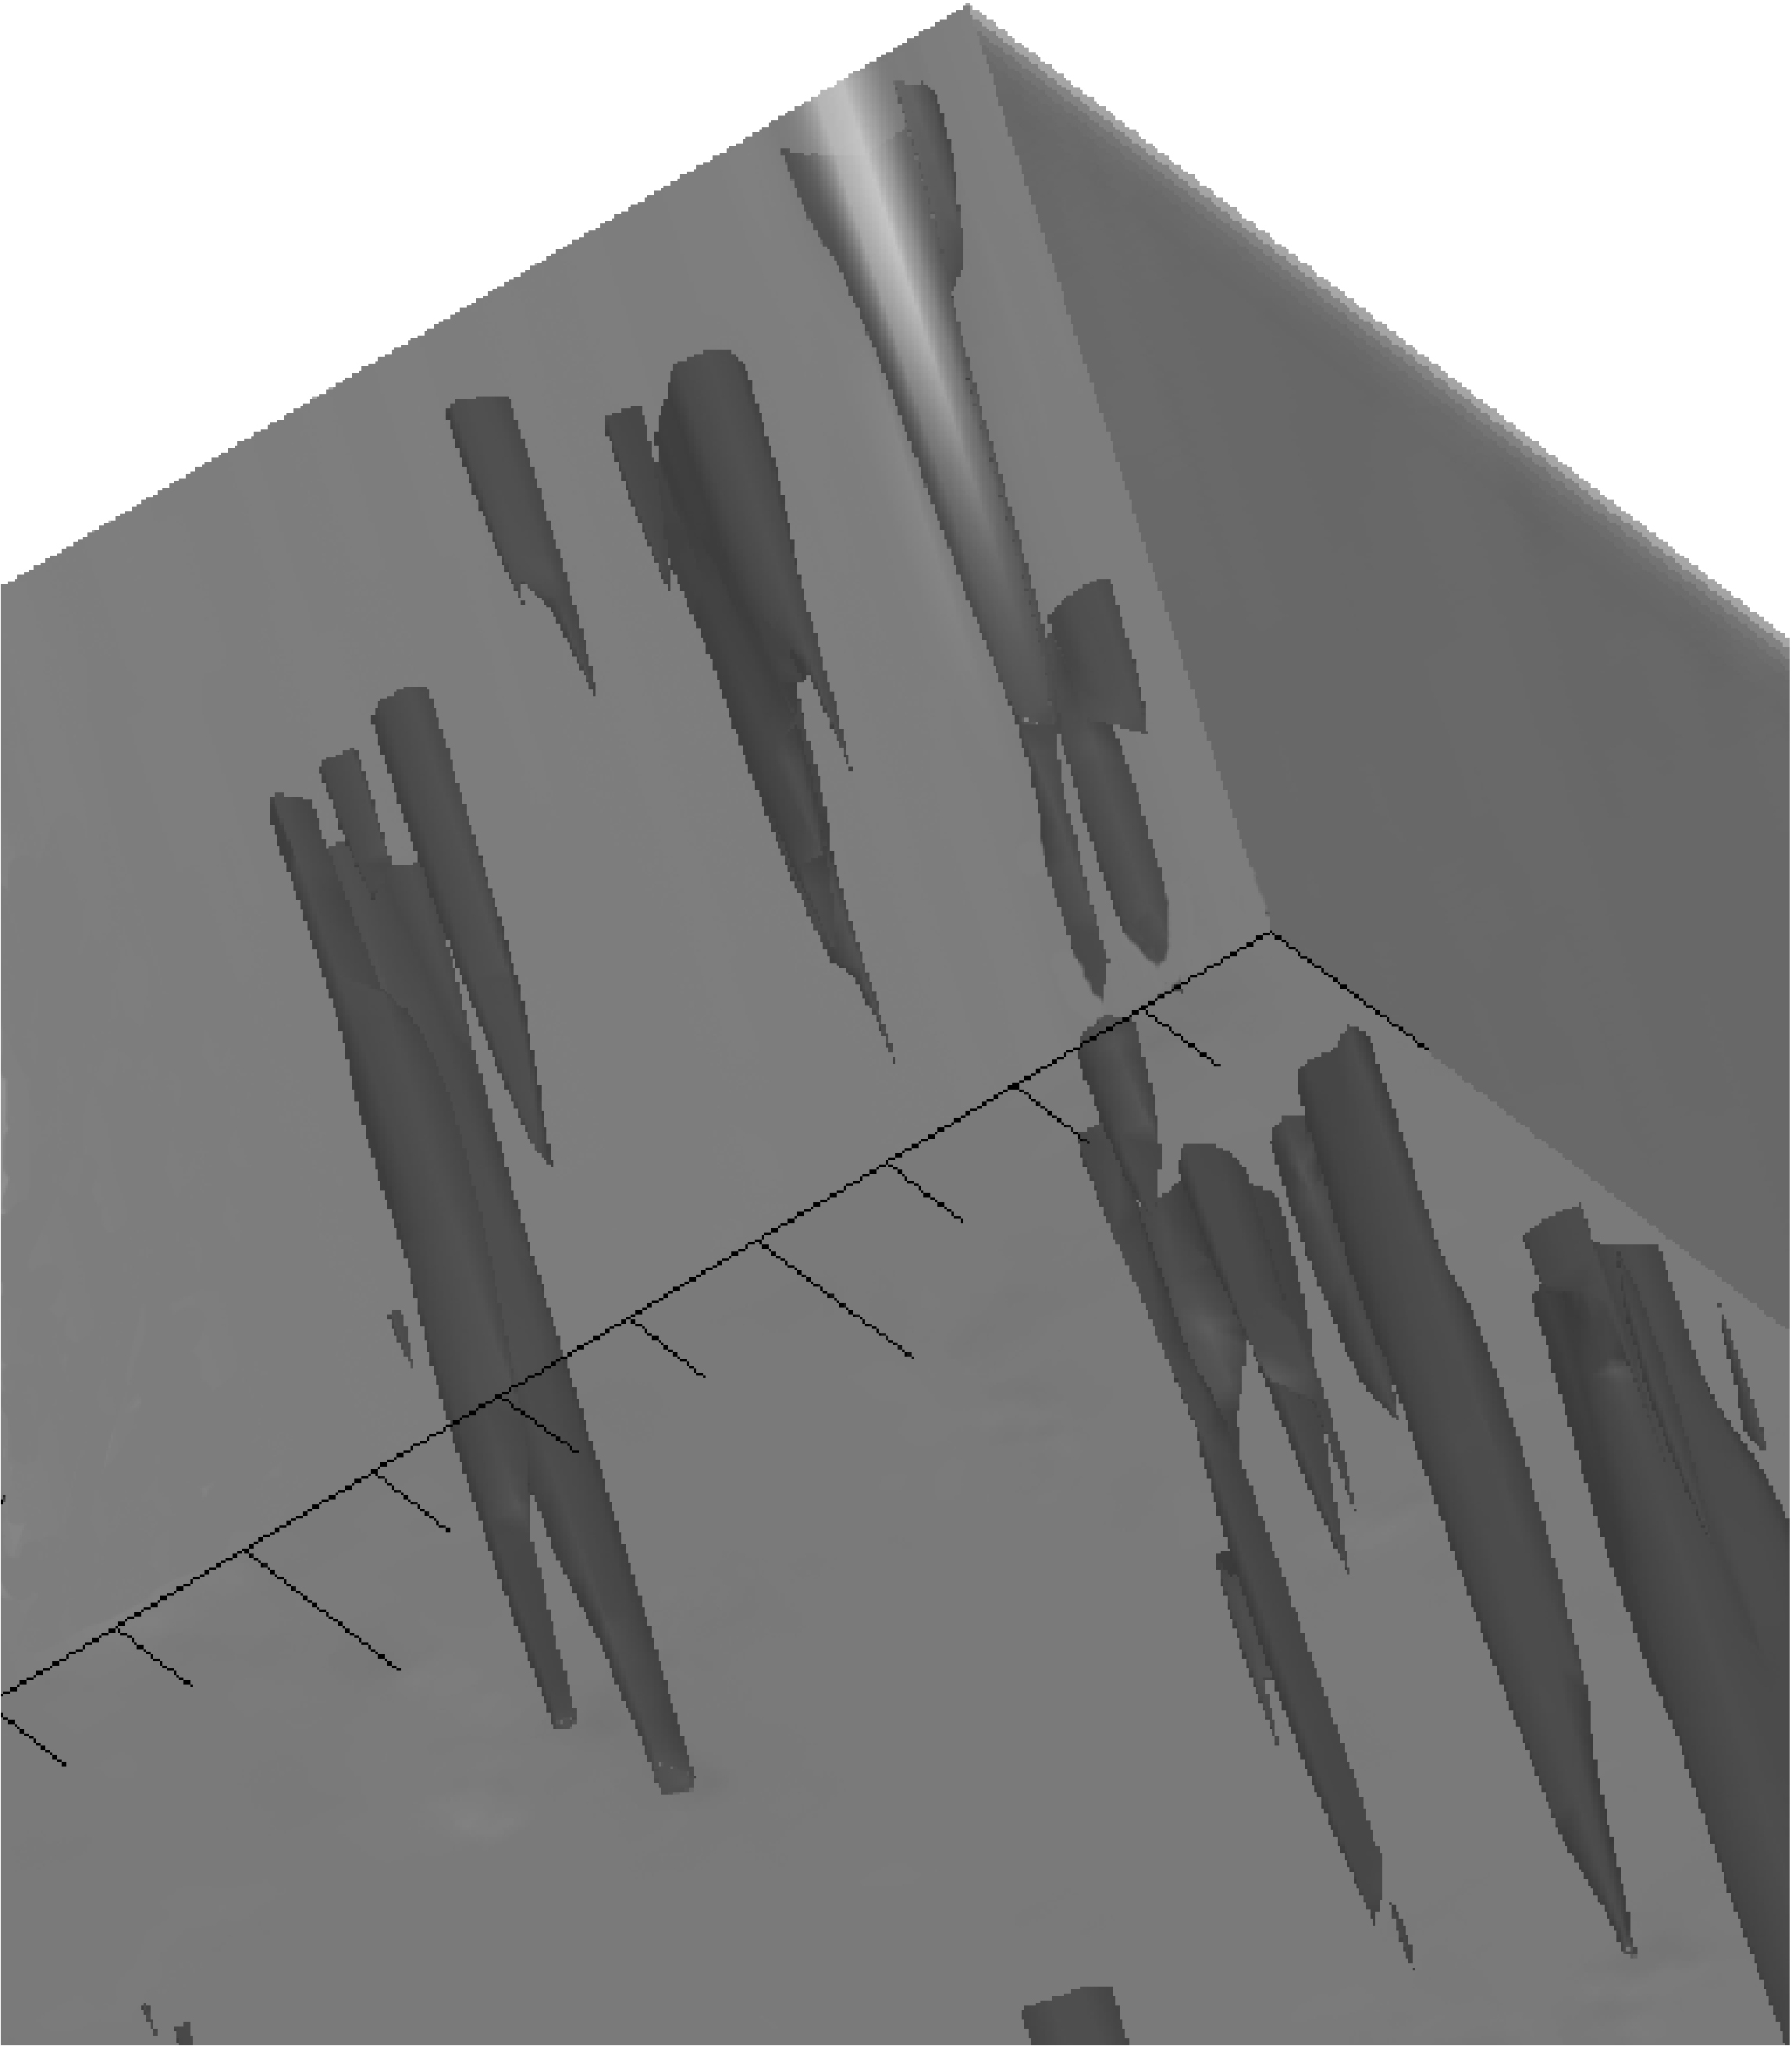
The figures on the right show the tomographic reconstructions as retrived from the spectropolarimetric
observations. Many of the magnetic structures seen in the figures do not seem
to reach the upper photosphere (a strong decline of the magnetic flux and
topological coherence from the bottom to the top photosphere).
It will be of particular interest to see in upcoming investigations
if these small-scale magnetic fields are "connected" to the upper atmosphere
(chromosphere and corona) and to assess their significance for the total
magnetic energy budget of the solar atmosphere.
Reference
Contact
Dr. Thorsten Carroll
Astrophysikalisches Institut Potsdam
An der Sternwarte 16
D-14482 Potsdam
(0331) 7499 539

Markus Kopf
(0331) 7499 207

[Stellar activity pages]
[AIP home page]
|
|
|
|

 last change 2008 June 27, R. Arlt