|
In the final stages of evolution of stars which have too little mass to turn into an exploding supernova these stars instead lose all the mass
outside the hot core in an intense stellar wind. Such winds are the most intense in cool and pulsating stars, so-called asymptotic giant branch
(AGB) stars. During a relatively brief period of a few thousand years after all mass has been lost the remaining exposed core of the star can
ionize the surrounding mass, the object is then a planetary nebula (PN). Compared to the age of these stars the PN stage is very short, which
is why their number is low. However, since most of the energy in a PN is radiated in a few emission lines in the visual wavelength range they
are relatively easy to find and to study. A PN consists of shocked and restructured ionized matter. For slightly evolved PNe the surrounding
matter, outside the PN itself, is also ionized – forming a weakly emitting halo. Such halos provide physical properties of the final mass
loss stage on the AGB. Our study focused on the halo. Two images of one larger and one smaller PN in our study are shown in Figures 1a and b.
Since halos of PNe are so weak they are difficult to observe; up to now spectroscopic studies of PN halos measure a single point. In our study
we instead adopted the method of integral field spectroscopy, through the PMAS instrument that is mounted on the 3.5m telescope at Calar Alto.
PMAS has two different integral field units (IFUs) that each covers a fixed area on the sky and provides a simultaneous sampling of several
hundred spectra. There are several advantages of this method. Data is sampled under homogeneous observational conditions, and individual spectra
can easily be binned to increase the signal-to-noise, which is a useful property with weak halos. The two-dimensional intensity structure that
we observed for a part of the surface of two strong emission lines of the Blue Snowball PN (NGC 7662) is shown in Figure 2.
Stellar winds off AGB stars are to a good approximation spherically symmetric. In order to increase the signal-to-noise of the data in the halo
we therefore summed individual spectra along concentric arcs radially, see the example in Figure 3. For four objects we could thereby derive a
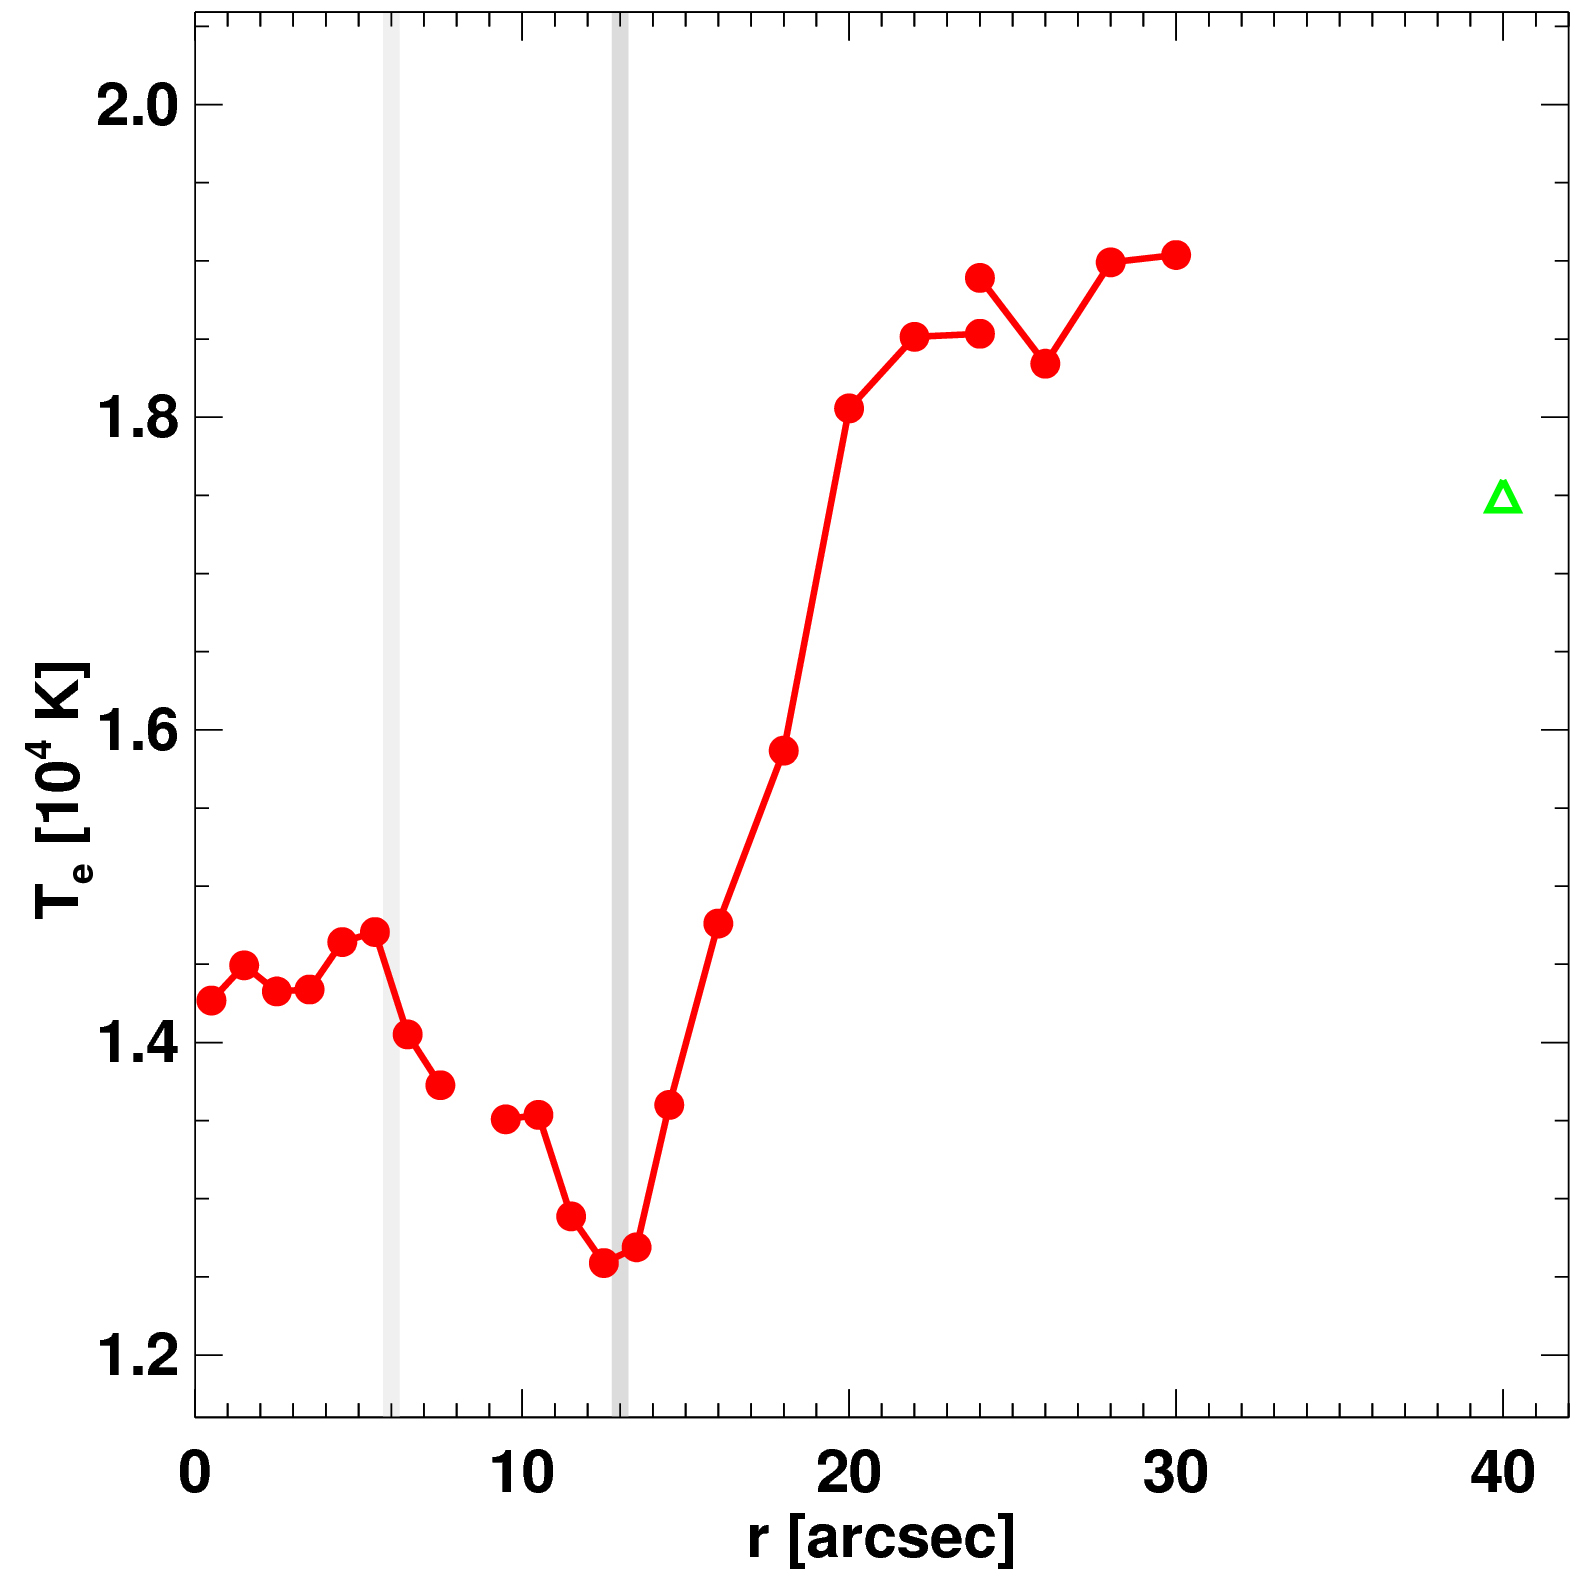
temperature structure, which extended all the way from the central star and out into the halo. In comparison to previous studies our densely
sampled structures in three cases show that the temperature increases steeply in the inner halo, see the example in Figure 4 for NGC 7662. A
halo that is hotter than the PN indicates that it is not in thermal equilibrium. Time-dependent radiationhydrodynamic models, such as those which
have been developed at AIP, can readily explain the appearance of such hot halos as a transient phenomenon that occurs when the halo is being
ionized.
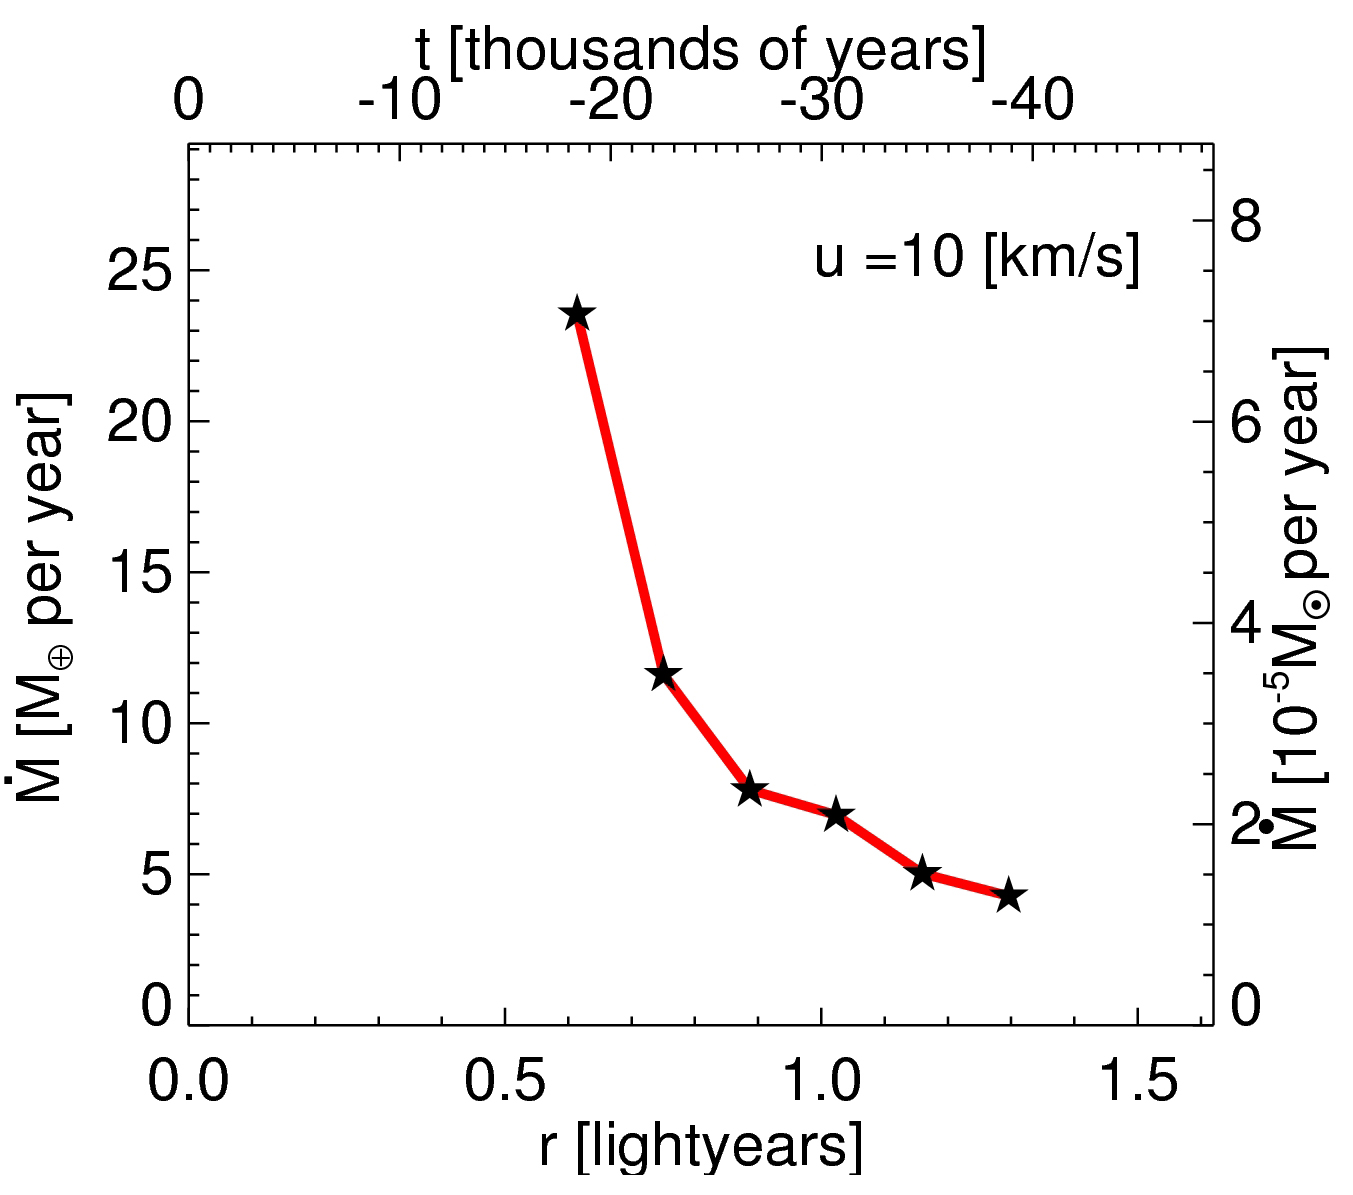
Another remarkable result of our study is that we for four objects could calculate the mass loss history of the final evolution on the AGB. In
comparison to other methods which measure mass loss rates, our estimates are made directly on the gas component of the stellar wind. In every
case we found that the mass loss rate increases by a factor of about 4-7 during the final, say, 10,000 years of mass loss. And final values on
the mass loss rate, which depend on the distance to the object and assumed outflow velocities, reach about 10 solar masses per
year. An example of the mass loss history of the Blinking Eye PN (NGC 6826) is shown in Figure 5. solar masses per
year. An example of the mass loss history of the Blinking Eye PN (NGC 6826) is shown in Figure 5.
Continuing our studies of halos of PNe we are now working with data of PNe in the Magellanic Clouds. Our purpose is to also with these objects
find halos and measure temperature structures and mass loss rates. On the theoretical side the results of our studies should provide a challenging
bases for further improvement of models of stellar winds.
Reference
Contact
Dr. Christer Sandin
Astrophysikalisches Institut Potsdam
An der Sternwarte 16
D-14482 Potsdam
(0331) 7499 358

Prof. Detlef Schönberner
(0331) 7499 395

Dr. Martin Roth
(0331) 7499 313

[Stellar physics pages]
[3D spectroscopy pages]
[AIP home page]
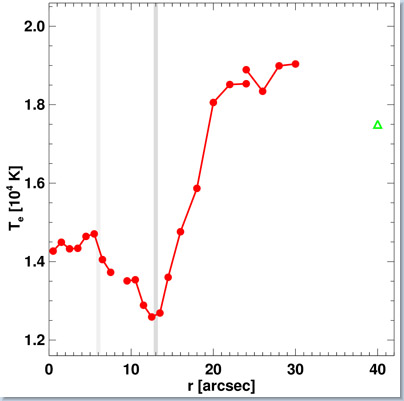
Figure 4: Using maps of spatial elements, such as the one shown in Figure 3, we reduced the two-dimensional data into one-dimensional radial structures
which extend from the central star and as far out into the halo as was possible for each object. In this figure we show the electron temperature
Te of NGC 7662, which was derived using three emission lines of oxygen. In this figure the halo extends outwards from about r=13
arcseconds. Note the steep gradient where the temperature increases when moving outwards. The only previous temperature measurement in the halo
is shown with a green symbol.
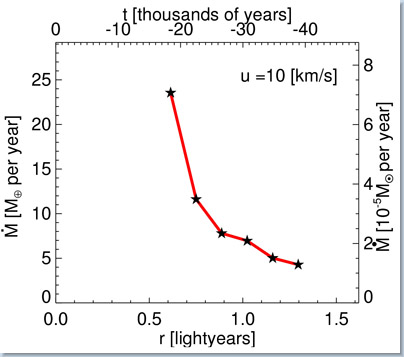
Figure 5: In the inner part of the halo, which is the ionized stellar wind of the AGB phase, one can at first derive a density structure of the gas using
one of the hydrogen emission lines. This density can thereafter be converted into a mass loss rate using an estimate of the outflow velocity
throughout the halo. This figure shows a radial mass loss rate structure, or mass loss history, in the inner halo of NGC 6826. An outflow
velocity of 10 km/s was assumed throughout the object. During the final 20,000 years of evolution it is seen that the mass loss rate increases
by about a factor 5, and the final mass loss rate reaches about 7*10 solar masses per year. solar masses per year.
|
|
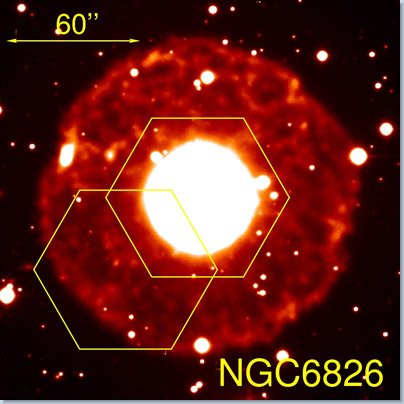
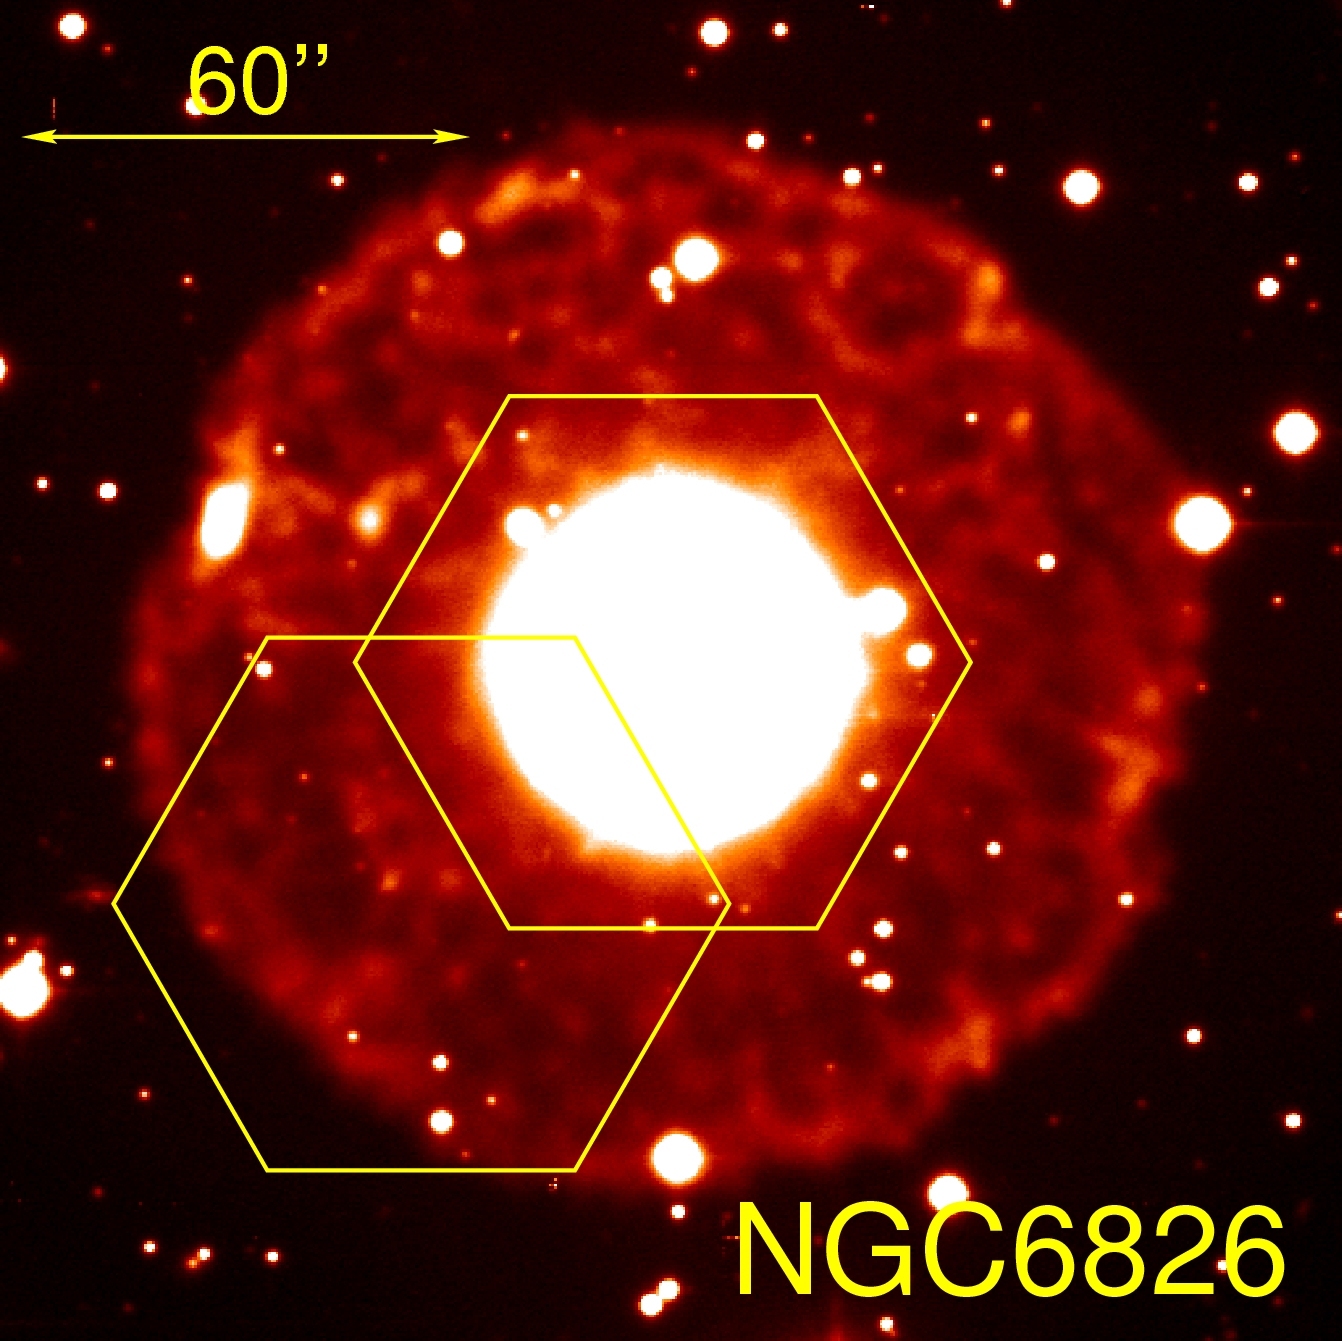
Figure 1a: This image, which is taken from Corradi et al. 2003, was captured using an H-alpha
filter in order to show the halo surrounding the spatially extended PN NGC 6826. The central white region of the PN is so bright that it is saturated
in this image. Because of its large size we observed this object in two separate exposures in late October 2006, using the PMAS PPAK IFU;
the geometrical size of the PPAK IFU is shown with yellow hexagons.
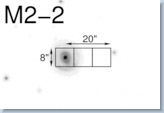
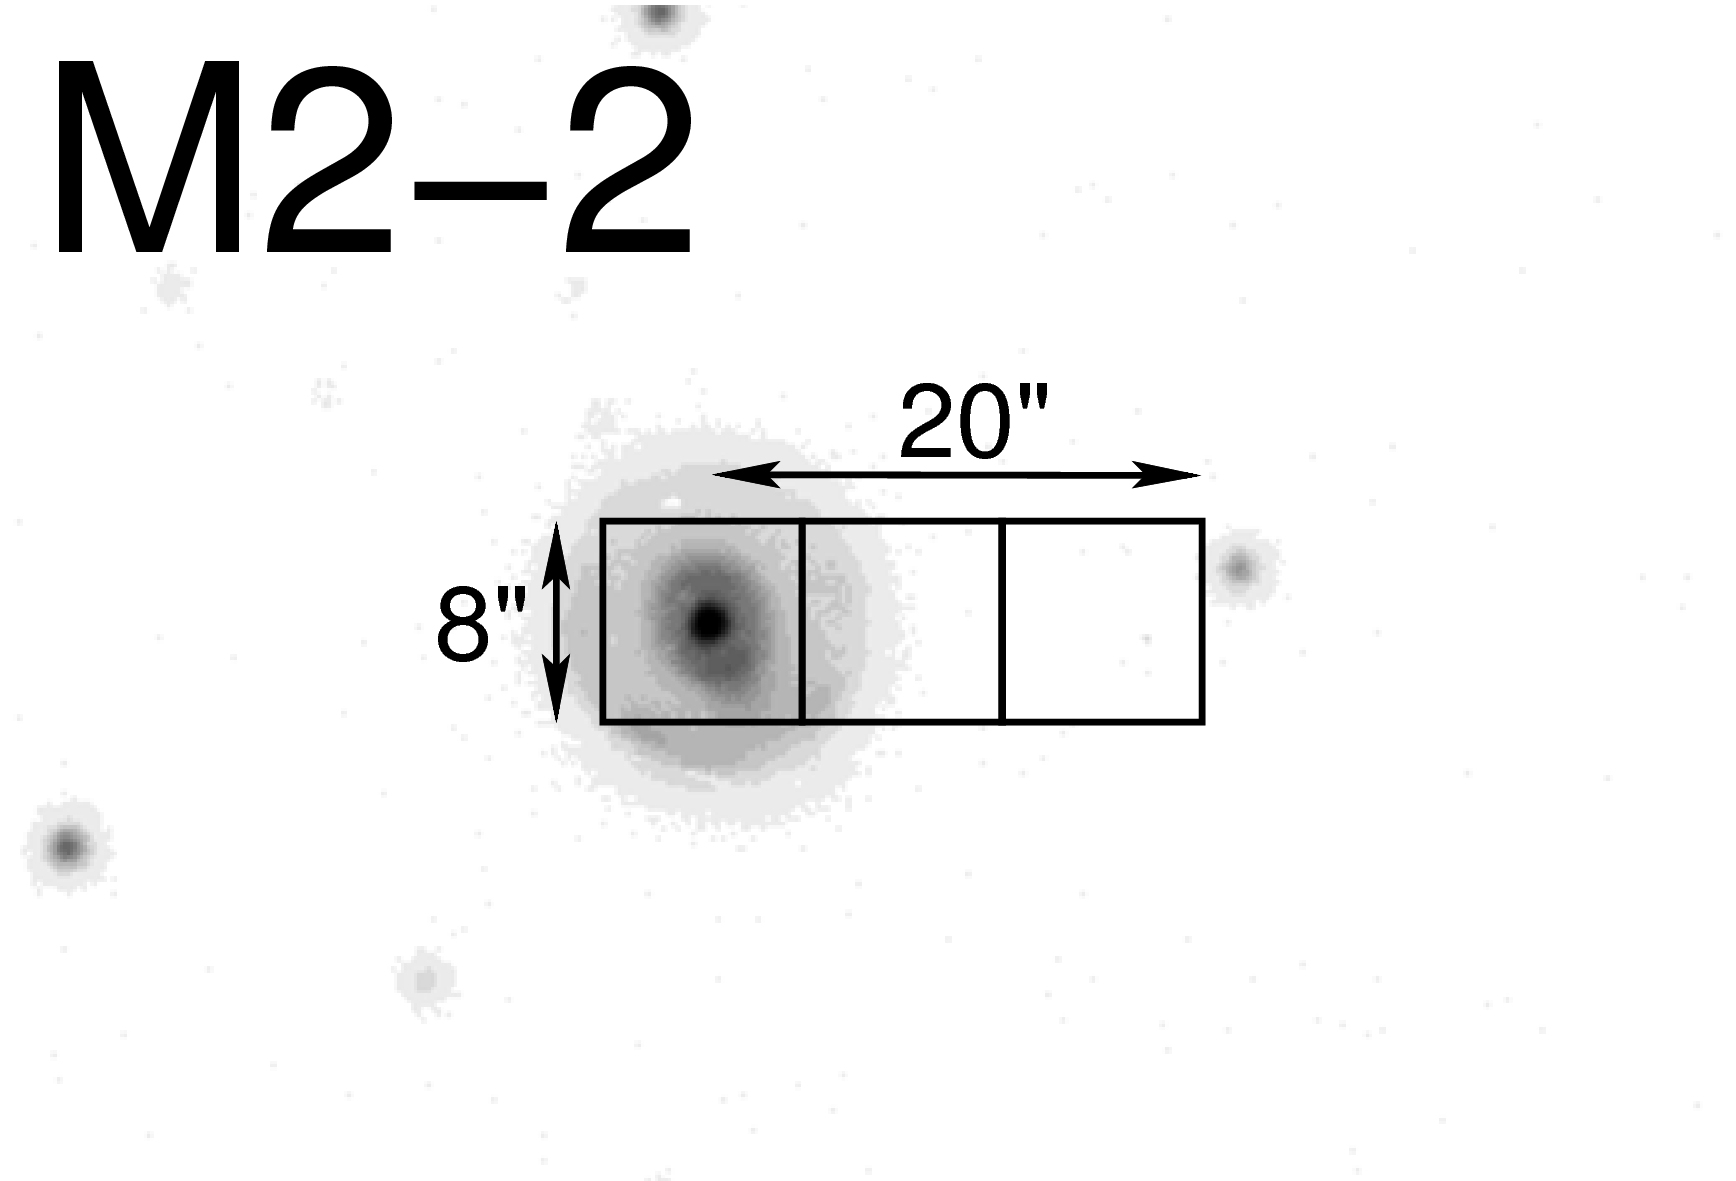
Figure 1b: In order to make a comparison of different sizes of PNe this figure shows the extent of the inner parts of the distant, and therefore small, PN
M 2-2; compare it with NGC 6826 in Figure 1a. The halo of this object, that is not visible in this figure because of a too short exposure time,
extends to a radius of about r=20 arcseconds out from the central star. Because M 2-2 is so small we observed it in October 2007, using the
smaller magnification scale of the lens array IFU of PMAS, in three offset exposures that are indicated with rectangles.
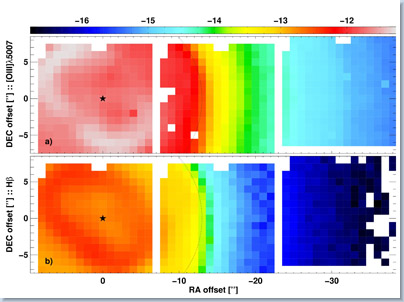
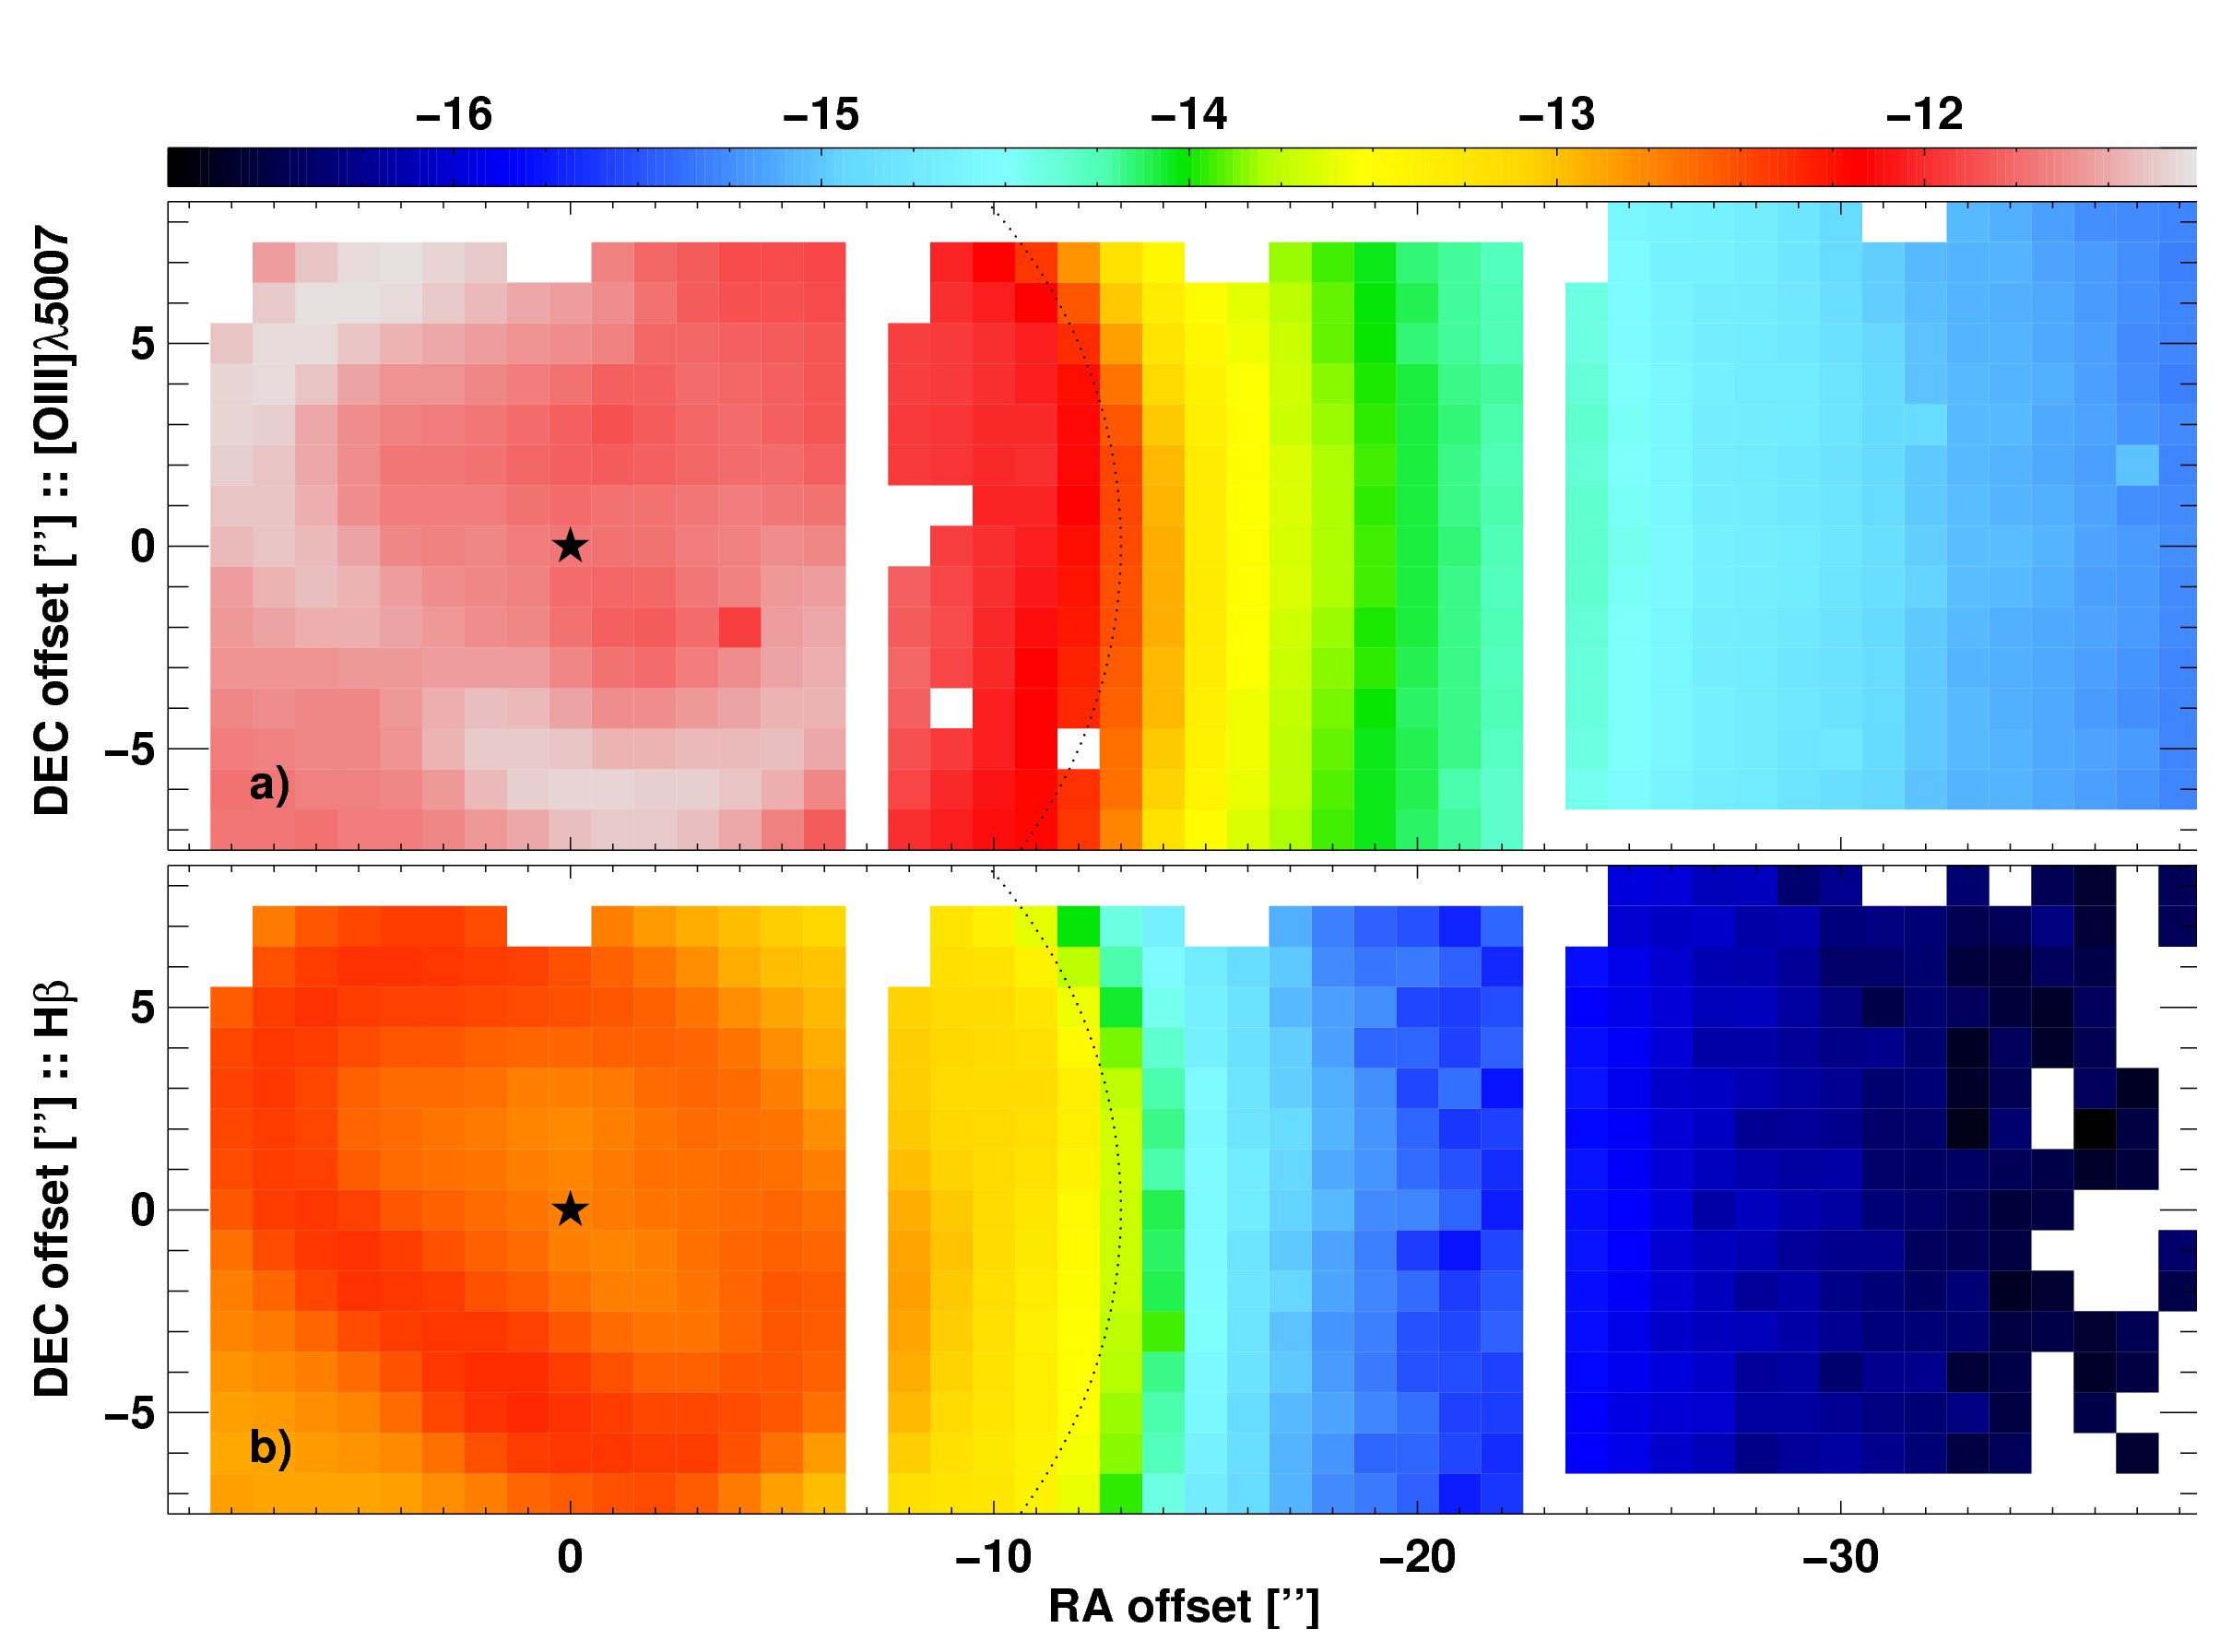
Figure 2: This figure shows a two-dimensional intensity map of two strong emission lines that we observed in the central nebula (left hand side), as well
as in the halo (right hand side). We used three separate, and offset, exposures with the larger magnification scale of the lens array IFU of
PMAS. Each colored square covers an area of 1.0 arcsecond on the sky, and represents the signal detected in one of the 256 so-called
spatial elements on this IFU. The intensity of both emission lines is shown with the same scale, where more red and white colors indicate
a stronger intensity. Since the intensity decreases by a factor of 10,000 between the elliptical rim, seen to the left, and the weak halo, it
was necessary to use a logarithmic scale to show all of the structure simultaneously. Data in the white regions on the edges of each of the three
IFU pointing were removed in the procedure where we corrected the data for differential atmospheric refraction. Data in the remaining white boxes is missing. on the sky, and represents the signal detected in one of the 256 so-called
spatial elements on this IFU. The intensity of both emission lines is shown with the same scale, where more red and white colors indicate
a stronger intensity. Since the intensity decreases by a factor of 10,000 between the elliptical rim, seen to the left, and the weak halo, it
was necessary to use a logarithmic scale to show all of the structure simultaneously. Data in the white regions on the edges of each of the three
IFU pointing were removed in the procedure where we corrected the data for differential atmospheric refraction. Data in the remaining white boxes is missing.
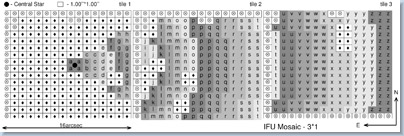
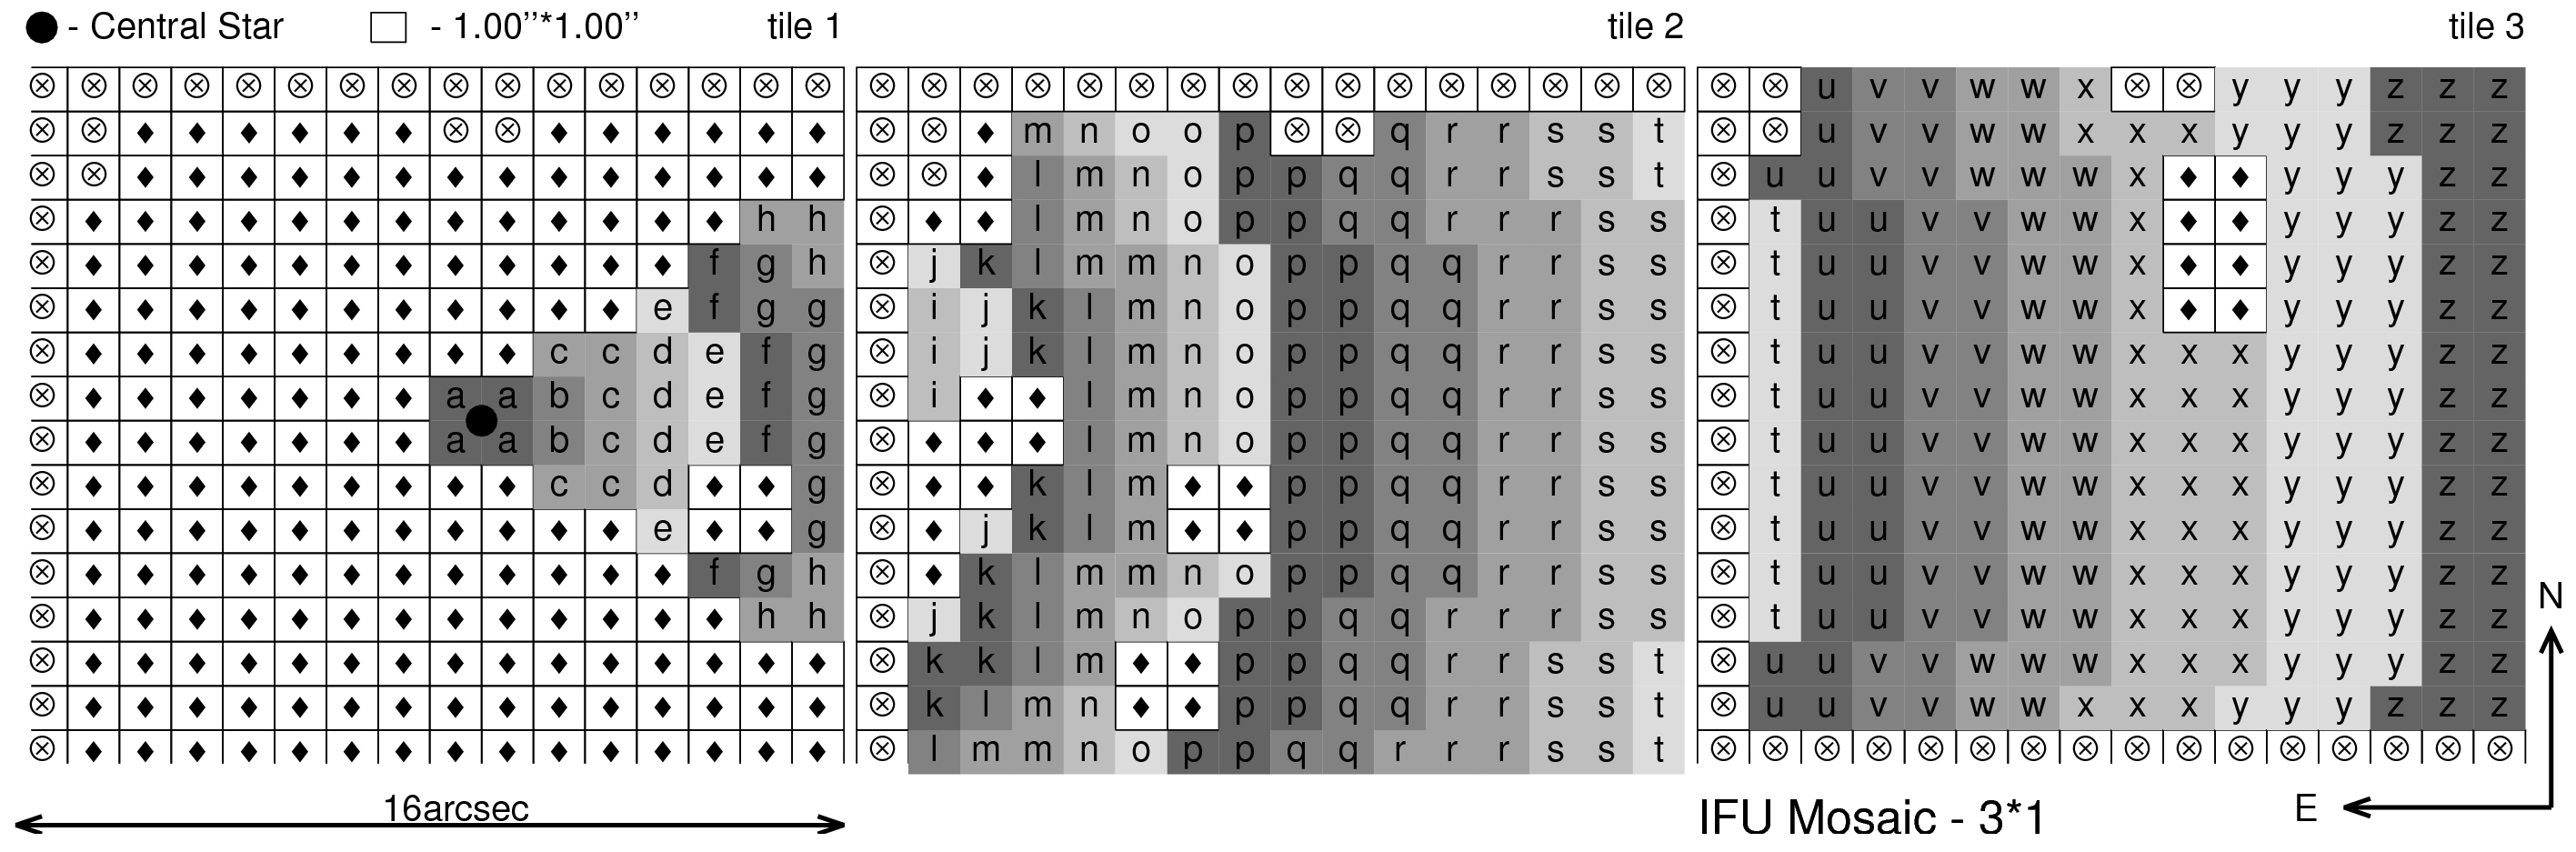
Figure 3: In order to make a measurement of physical properties in the weak halo possible we summed the spectra of the spatial elements on the IFUs along
concentric arcs, which were centered on the central star. This figure shows a map of arcs, which are shown in different shades of gray, for
the data used with NGC 7662; elements which belong to the same arc are also marked with the same letter. Compensating for the much lower flux
in the halo (right hand side) the arcs are there 3 elements wide, where as they are only 1 element wide near the much brighter center of the nebula.
Additionally, in the central part we masked out most of the aspherical region in order to get a smooth transition between the intensity
structures sampled in the central and middle exposures. Circled crosses mark elements that were not used.
|
|
|

 last change 2008 July 28, R. Arlt