| Back to image index |
|
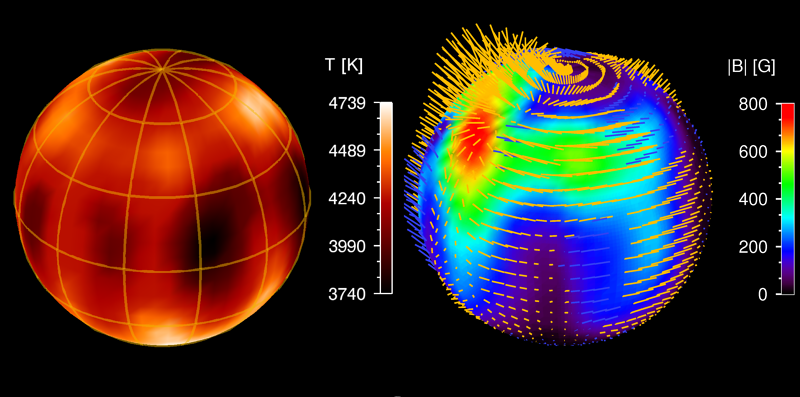
Temperature map (left) and surface magnetic field map (right) of II Pegasi. The "needles" in the right image indicate the field vector for each surface pixel and the color represents the absolute field strength.
Graph: T. Carroll, M. Kopf, I. Ilyin, K.G. Strassmeier
[web size] [full size]
more at /highlight_archive/carroll_iipeg/ (image added 2008-01-21) |
|
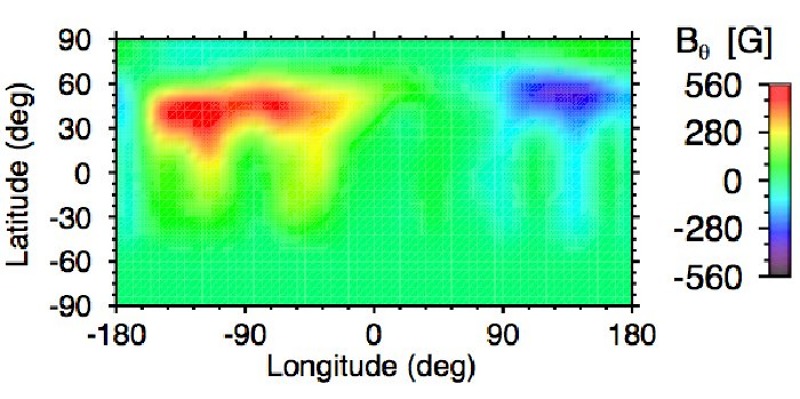
Mercator map of the azimuthal magnetic field of II Peg.
Graph: T. Carroll, M. Kopf, I. Ilyin, K.G. Strassmeier
more at /highlight_archive/carroll_iipeg/ (image added 2008-01-21) |
|
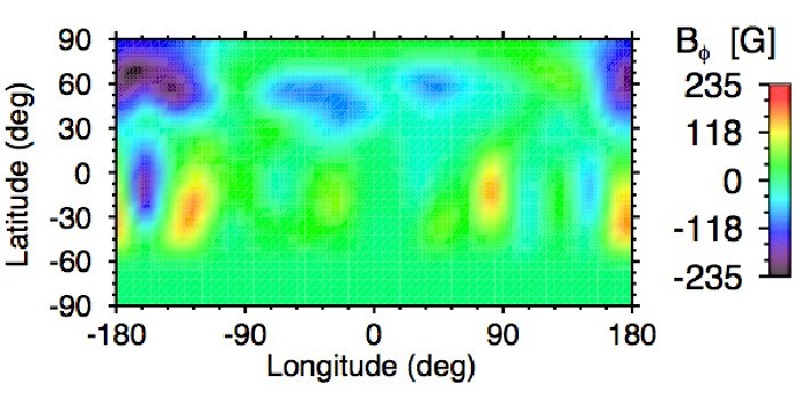
Mercator map of the meridional magnetic field of II Peg.
Graph: T. Carroll, M. Kopf, I. Ilyin, K.G. Strassmeier
more at /highlight_archive/carroll_iipeg/ (image added 2008-01-21) |
|
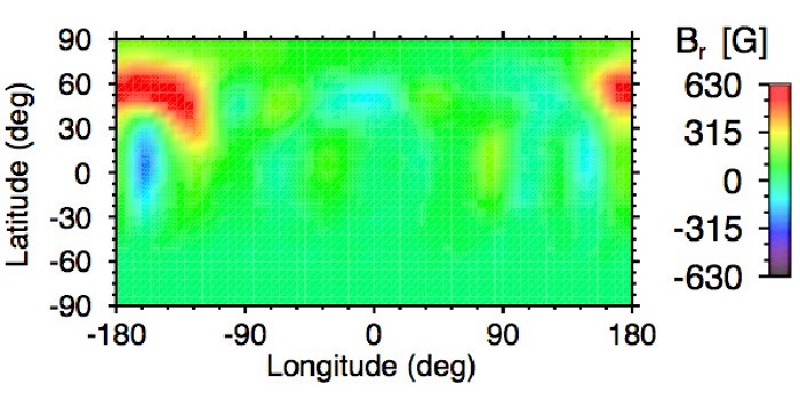
Mercator map of the radial magnetic field of II Peg.
Graph: T. Carroll, M. Kopf, I. Ilyin, K.G. Strassmeier
more at /highlight_archive/carroll_iipeg/ (image added 2008-01-21) |
|
B light curve of HK Lac. The green line connects photographic seasonal averages, the red one shows median values. Bars indicate the standard error of the mean. Over-plotted are the photoelectric measurements.
Graph: H.-E. Fröhlich
[web size] [full size]
more at /People/hefroehlich/ (image added 2006-02-07) |
|
Active longitudes: Phases of the spots on AB Dor. Filled circles denote primary spots, open circles secondary spots and the + symbol is used when it is not possible to say which spot is the primary one. Two active longitudes are traced by solid lines and the vertical dashed lines show when flip-flops occur.
Graph: S. Järvinen
[web size] [full size]
more at /groups/activity/ (image added 2006-02-07) |
|
Active longitudes: Phases of the spots on EK Dra. Filled circles denote primary spots, open circles secondary spots and + symbol is used when it is not possible to say which spot is the primary one. Two active longitudes are traced by solid lines and the vertical dashed lines show when flip-flops occur.
Graph: S. Järvinen
[web size] [full size]
more at /groups/activity/ (image added 2006-02-07) |
|
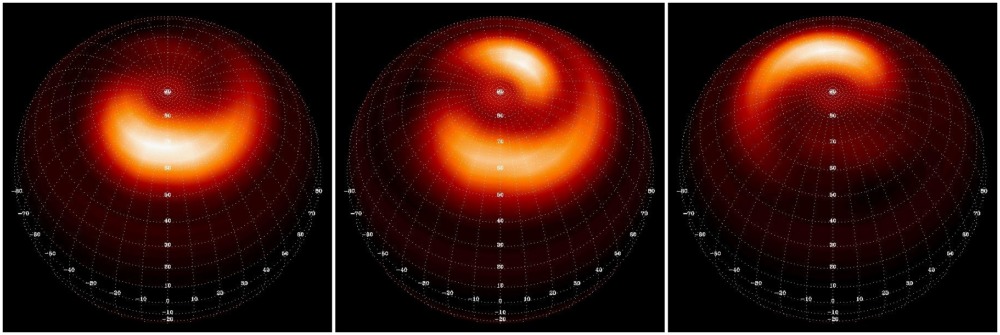
Simulation of a mean-field dynamo with non-axisymmetric solutions explaining the flipflop phenomenon. Snapshots of the surface magnetic field strength for one flip-flop cycle.
Graph: D. Elstner, H. Korhonen
[web size] [full size]
more at /People/hkorhonen/ (image added 2006-02-01) |

 last change Sat, 12 Mar 2011 11:52:50 GMT, U. Hanschur


![[full size]](images/IIPeg-DI_ZDI-Black_xl.png)
![[full size]](images/froehlich_hk_lac_xl.gif)
![[full size]](images/jarvinen_ab_dor_xl.gif)
![[full size]](images/jarvinen_ek_dra_xl.gif)
![[full size]](images/korhonen_elstner_flipflop_xl.jpg)