
 |
|
|
 |
|
|
|
| last change Sat, 12 Mar 2011 11:52:50 GMT, U. Hanschur |
|
 |
 |
 |
 |
Stars: Planetary Nebulae |
 |
 |
 |
 |
 |
| Back to image index |
|
Halo of NGC 6826
Most of the stars, including the Sun, go through the Planetary Nebula (PN) phase at the end of their evolution. This short-lived but spectacular phenomenon marks the transition from a Red Giant star (about 100 times the present solar size) to a White Dwarf (1/100 the present size of the Sun). The very existence of Planetary Nebulae is a direct proof that stars which do not explode as supernovae loose a significant fraction of their mass at the end their active nuclear life, enriching the interstellar medium by freshly synthesized elements before they begin to cool toward the white dwarf cemetery.
NGC 6826 is a well-studied example of a bright double-shell PN of elliptical shape. The images were taken with the wide field camera at the prime focus of the 2.5m Isaac Newton Telescope of the ING at La Palma in October 2001, using a 100 Angstrom wide filter centered on H_alpha (including the [NII] doublet). The image is the result of 2.5 hours of integration (15 x 10 min) shows the faint extended halo. The long exposure time together with the short focal ratio of the prime focus of the INT makes this image clearly the deepest one ever obtained of NGC 6826.
The highly spherical halo represents material expelled by the red giant wind before the formation of the PN. Extensive hydrodynamical model calculations have been performed at the AIP in order to understand the formation and evolution of Planetary Nebulae and their haloes. Based on recent simulations, we could derive the mass loss history during the end of the previous AGB phase of evolution from the observed density structure of the halo of NGC 6826 (AGB wind paleontology). The results were presented at IAU Symposium No. 209 in Canberra (Australia) in November 2001.
Credits: R. Corradi (Isaac Newton Group), M. Steffen (AIP)
more at http://www.aip.de/groups/sternphysik/ (image added 2002-12-04) |
|
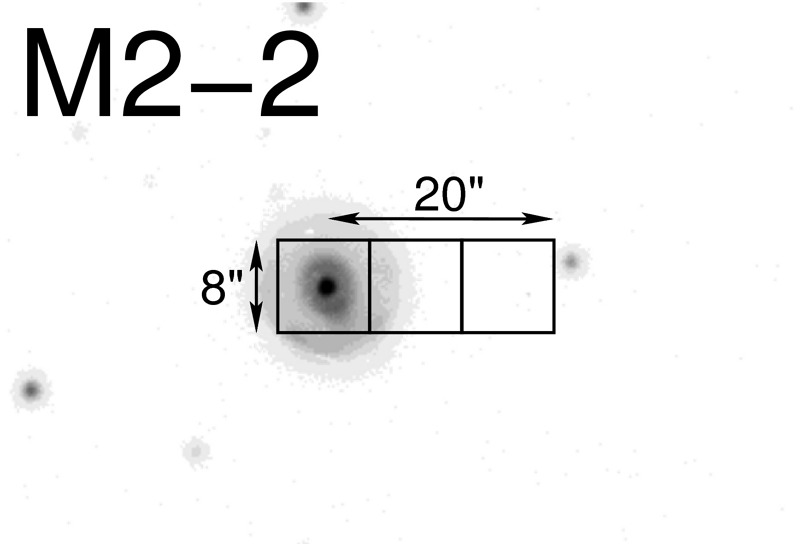
3D spectroscopy: In order to make a comparison of different sizes of PNe this figure shows the extent of the inner parts of the distant, and therefore small, PN M 2-2; compare it with NGC 6826 in Figure 1a. The halo of this object, that is not visible in this figure because of a too short exposure time, extends to a radius of about r=20 arcseconds out from the central star. Because M 2-2 is so small we observed it in October 2007, using the smaller magnification scale of the lens array IFU of PMAS, in three offset exposures that are indicated with rectangles.
Graph: C. Sandin
[web size] [full size]
more at /highlight_archive/sandin_pn/ (image added 2008-07-21) |
|
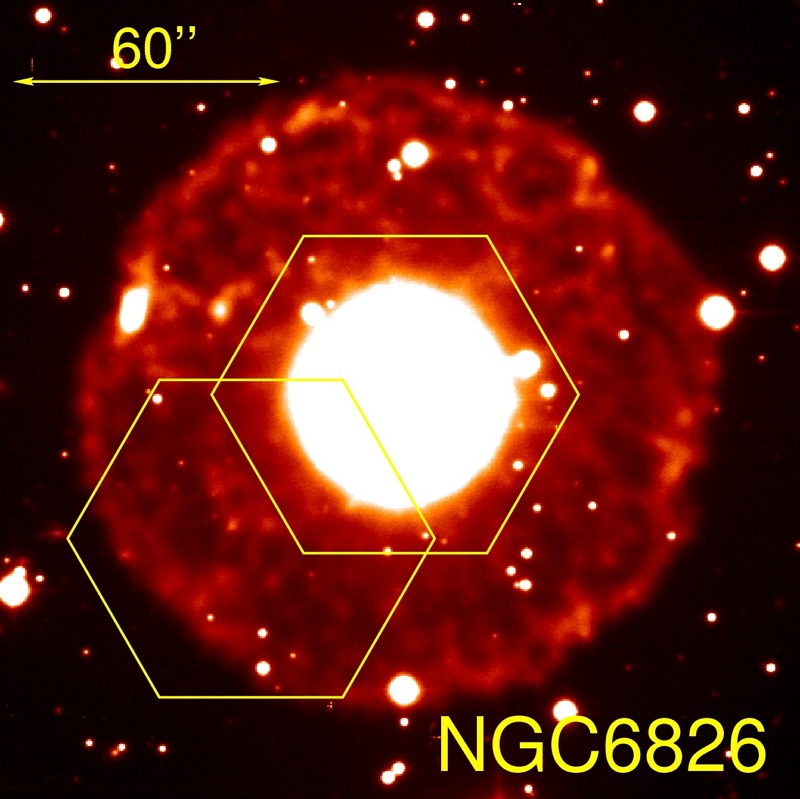
3D spectroscopy: This image, which is taken from Corradi et al. 2003, was captured using an H-alpha
filter in order to show the halo surrounding the spatially extended PN NGC 6826. The central white region of the PN is so bright that it is saturated
in this image. Because of its large size we observed this object in two separate exposures in late October 2006, using the PMAS PPAK IFU;
the geometrical size of the PPAK IFU is shown with yellow hexagons.
Overlay: C. Sandin
[web size] [full size]
more at /highlight_archive/sandin_pn/ (image added 2008-07-21) |
|
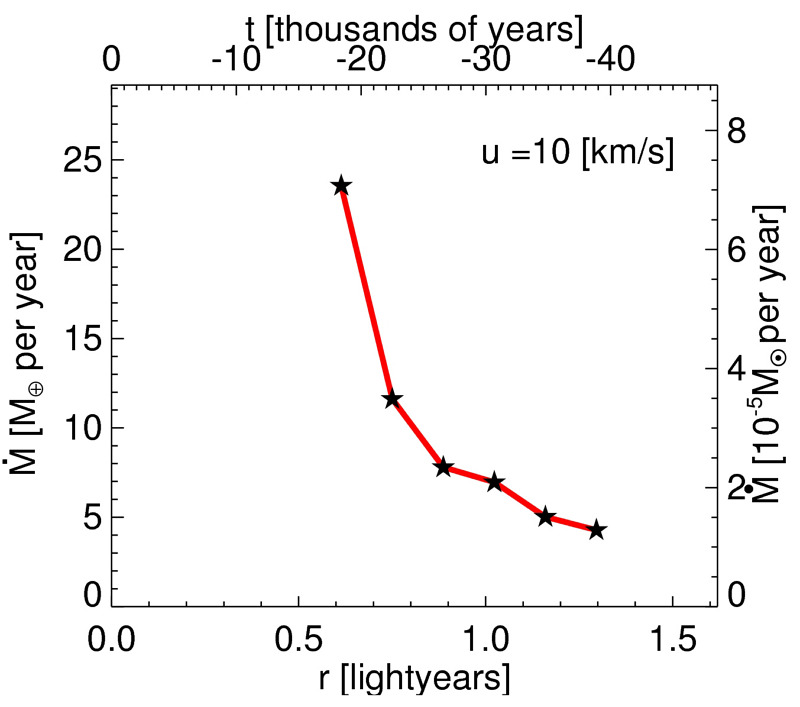
3D spectroscopy: In the inner part of the halo, which is the ionized stellar wind of the AGB phase, one can at first derive a density structure of the gas using
one of the hydrogen emission lines. This density can thereafter be converted into a mass loss rate using an estimate of the outflow velocity
throughout the halo. This figure shows a radial mass loss rate structure, or mass loss history, in the inner halo of NGC 6826. An outflow
velocity of 10 km/s was assumed throughout the object. During the final 20,000 years of evolution it is seen that the mass loss rate increases
by about a factor 5, and the final mass loss rate reaches about 7*10 solar masses per year. solar masses per year.
Graph: C. Sandin
[web size] [full size]
more at /highlight_archive/sandin_pn/ (image added 2008-07-21) |
|
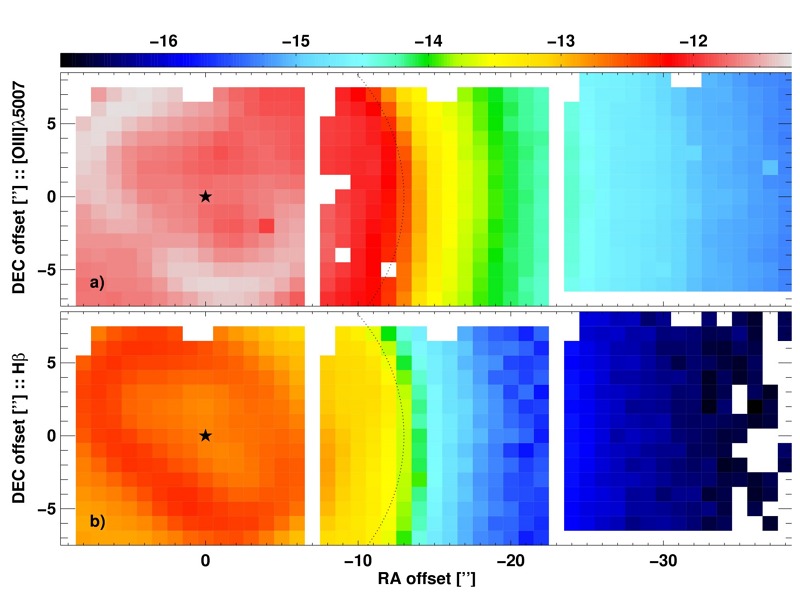
3D spectroscopy: This figure shows a two-dimensional intensity map of two strong emission lines that we observed in the central nebula (left hand side), as well
as in the halo (right hand side). We used three separate, and offset, exposures with the larger magnification scale of the lens array IFU of
PMAS. Each colored square covers an area of 1.0 arcsecond on the sky, and represents the signal detected in one of the 256 so-called
spatial elements on this IFU. The intensity of both emission lines is shown with the same scale, where more red and white colors indicate
a stronger intensity. Since the intensity decreases by a factor of 10,000 between the elliptical rim, seen to the left, and the weak halo, it
was necessary to use a logarithmic scale to show all of the structure simultaneously. Data in the white regions on the edges of each of the three
IFU pointing were removed in the procedure where we corrected the data for differential atmospheric refraction. Data in the remaining white boxes is missing. on the sky, and represents the signal detected in one of the 256 so-called
spatial elements on this IFU. The intensity of both emission lines is shown with the same scale, where more red and white colors indicate
a stronger intensity. Since the intensity decreases by a factor of 10,000 between the elliptical rim, seen to the left, and the weak halo, it
was necessary to use a logarithmic scale to show all of the structure simultaneously. Data in the white regions on the edges of each of the three
IFU pointing were removed in the procedure where we corrected the data for differential atmospheric refraction. Data in the remaining white boxes is missing.
Graph: C. Sandin
[web size] [full size]
more at /highlight_archive/sandin_pn/ (image added 2008-07-21) |
|
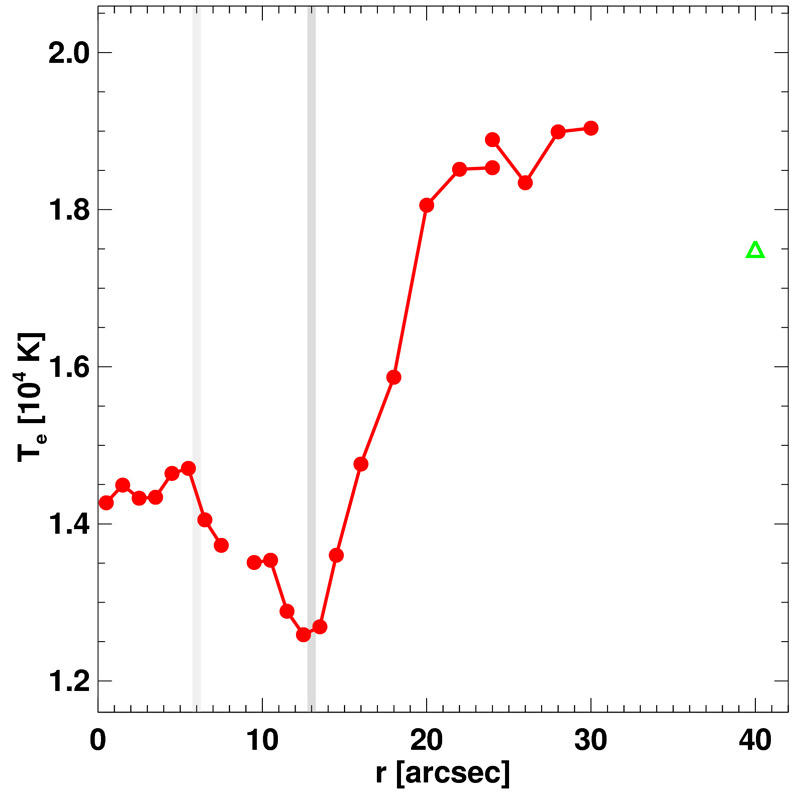
3D spectroscopy: Using maps of spatial elements, such as the one shown in Figure 3, we reduced the two-dimensional data into one-dimensional radial structures
which extend from the central star and as far out into the halo as was possible for each object. In this figure we show the electron temperature
Te of NGC 7662, which was derived using three emission lines of oxygen. In this figure the halo extends outwards from about r=13
arcseconds. Note the steep gradient where the temperature increases when moving outwards. The only previous temperature measurement in the halo
is shown with a green symbol.
Graph: C. Sandin
[web size] [full size]
more at /highlight_archive/sandin_pn/ (image added 2008-07-21) |
|
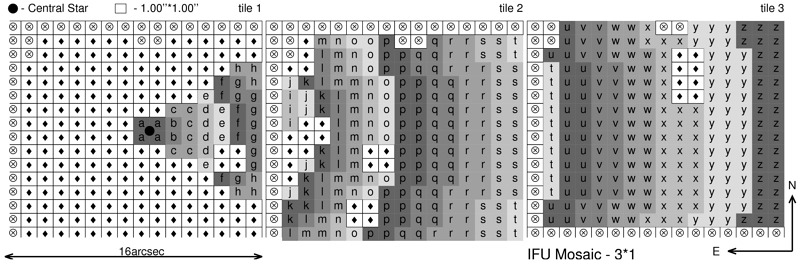
3D spectroscopy: In order to make a measurement of physical properties in the weak halo possible we summed the spectra of the spatial elements on the IFUs along
concentric arcs, which were centered on the central star. This figure shows a map of arcs, which are shown in different shades of gray, for
the data used with NGC 7662; elements which belong to the same arc are also marked with the same letter. Compensating for the much lower flux
in the halo (right hand side) the arcs are there 3 elements wide, where as they are only 1 element wide near the much brighter center of the nebula.
Additionally, in the central part we masked out most of the aspherical region in order to get a smooth transition between the intensity
structures sampled in the central and middle exposures. Circled crosses mark elements that were not used.
Graph: C. Sandin
[web size] [full size]
more at /highlight_archive/sandin_pn/ (image added 2008-07-21) |
|
 |
 |
 |
 |
|
|
![[full size]](images/sandin_ag20050913_xl.jpg)
![[full size]](images/sandin_NGC6826_OIII_xl.jpg)
![[full size]](images/sandin_NGC6826_radial_mrat_xl.jpg)
![[full size]](images/sandin_NGC7662_colormosaic_xl.jpg)
![[full size]](images/sandin_NGC7662_radial_Te_xl.jpg)
![[full size]](images/sandin_spaxelmap_NGC7662_xl.jpg)