| Back to image index |
|
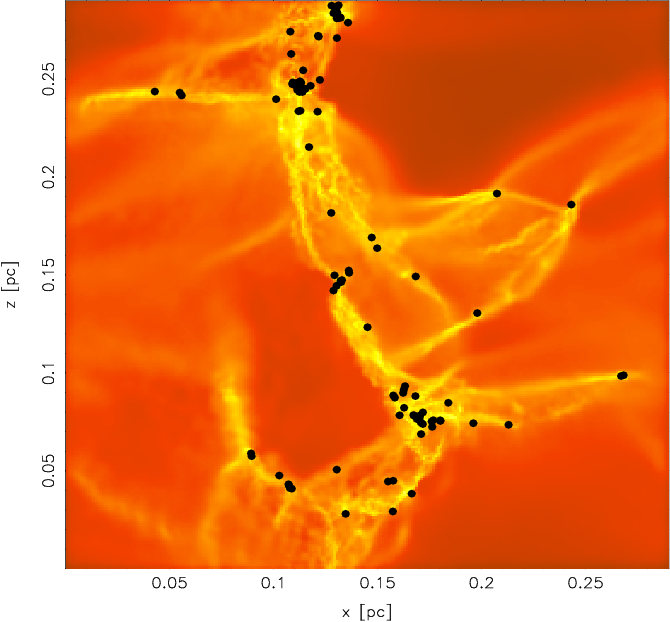
Non-isothermal gravoturbulent framentation: column density map of the gravitational fragmentation of the simulated gas cloud. The black circles indicate the locations of identified protostellar objects.
Graph: A.-K. Jappsen
more at /People/akjappsen/ (image added 2006-02-08) |
|
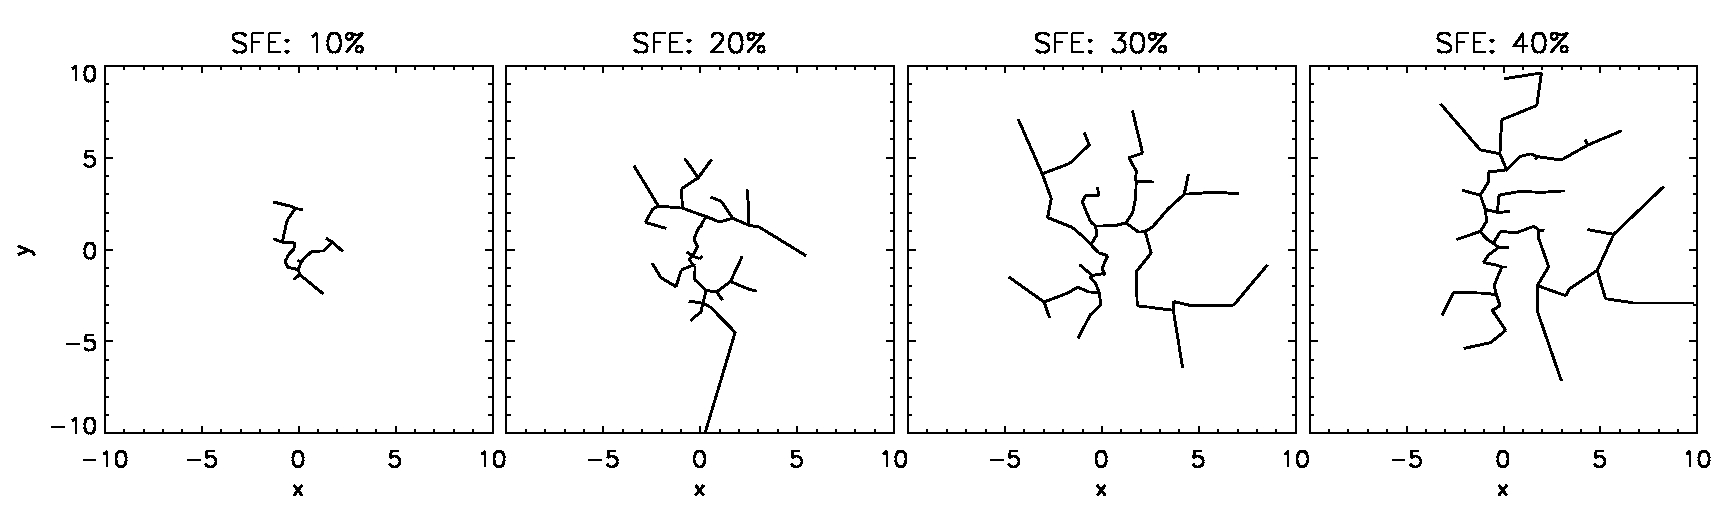
Structures of young star clusters: the minimum spanning tree of a model star cluster seen in projection at different times, indicating the growth of the cluster.
Graph: S. Schmeja
more at /People/sschmeja/ (image added 2006-02-08) |
|
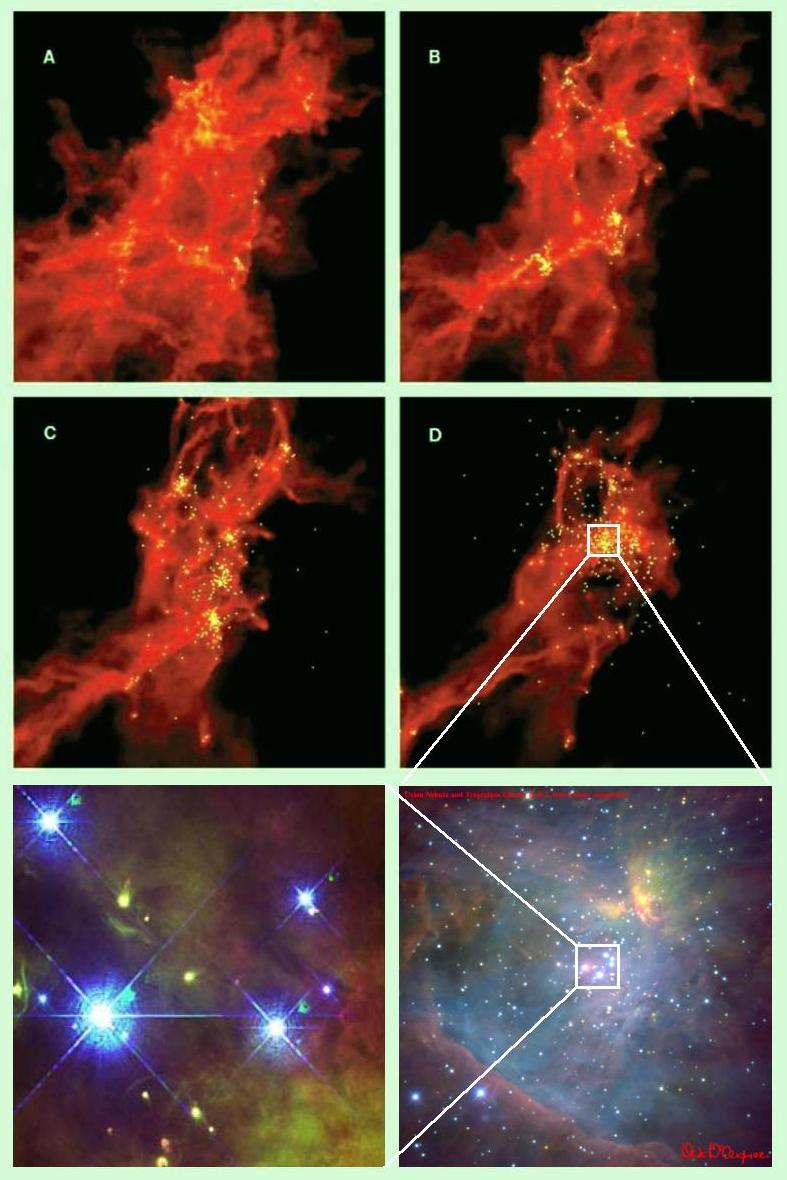
Origin of the Orion Trapezium system: numerical simulations have been carried out with the smoothed particle hydrodynamics (SPH) approach to model the gravitational collapse of a 1000 solar mass molecular cloud. Lower panel: infrared image of the Orion Nebula cluster (color composite) with the bright massive stars (Trapezium system) in the center.
more at /groups/starplan/ (image added 2006-02-08) |
|
Star formation in spiral galaxies: face-on view onto one of our model galaxies. Note the flocculent spiral pattern in the atomic gas (white-blue image), typical for isolated spiral galaxies. Yellow dots indicate regions of dense, molecular, star-forming gas.
Graph: R. Klessen
[web size] [full size]
more at /People/rklessen/ (image added 2006-02-08) |
|
Simulation of a T Tauri star with disk (beyond plotted area). Density distribution and the poloidal magnetic field in the immediate vicinity of the star in the funnel flow state. The colour contour plot shows the density distribution, the white lines the poloidal magnetic field.
Graph: M. Küker
[web size] [full size]
more at /highlight_archive/kgs_mnlupi/ (image added 2006-01-31) |
|
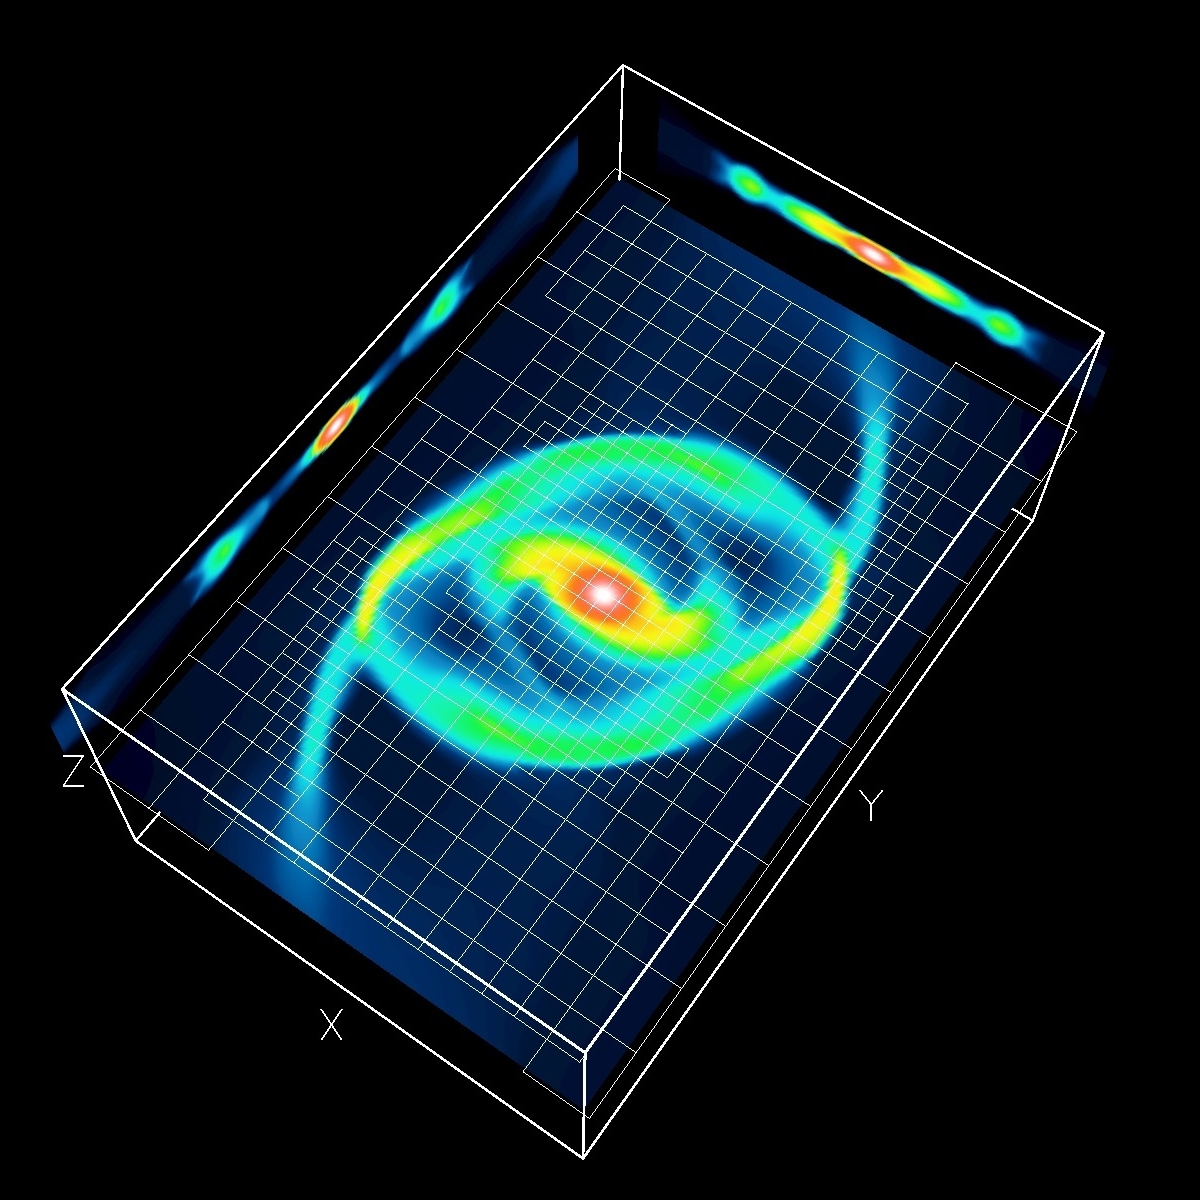
Sternentstehung: Dichteverteilung nach einem barotropen Kollaps ohne Magnetfeld.
Star formation: Density structure of a barotropic collapse without magnetic field, computed with NIRVANA3. The MHD computer code features adaptive mesh refinement and self-gravitation.
Graph: U. Ziegler
more at /highlight_archive/ziegler_amr/ziegler_selfgrav.pdf (image added 2005-07-07) |
|
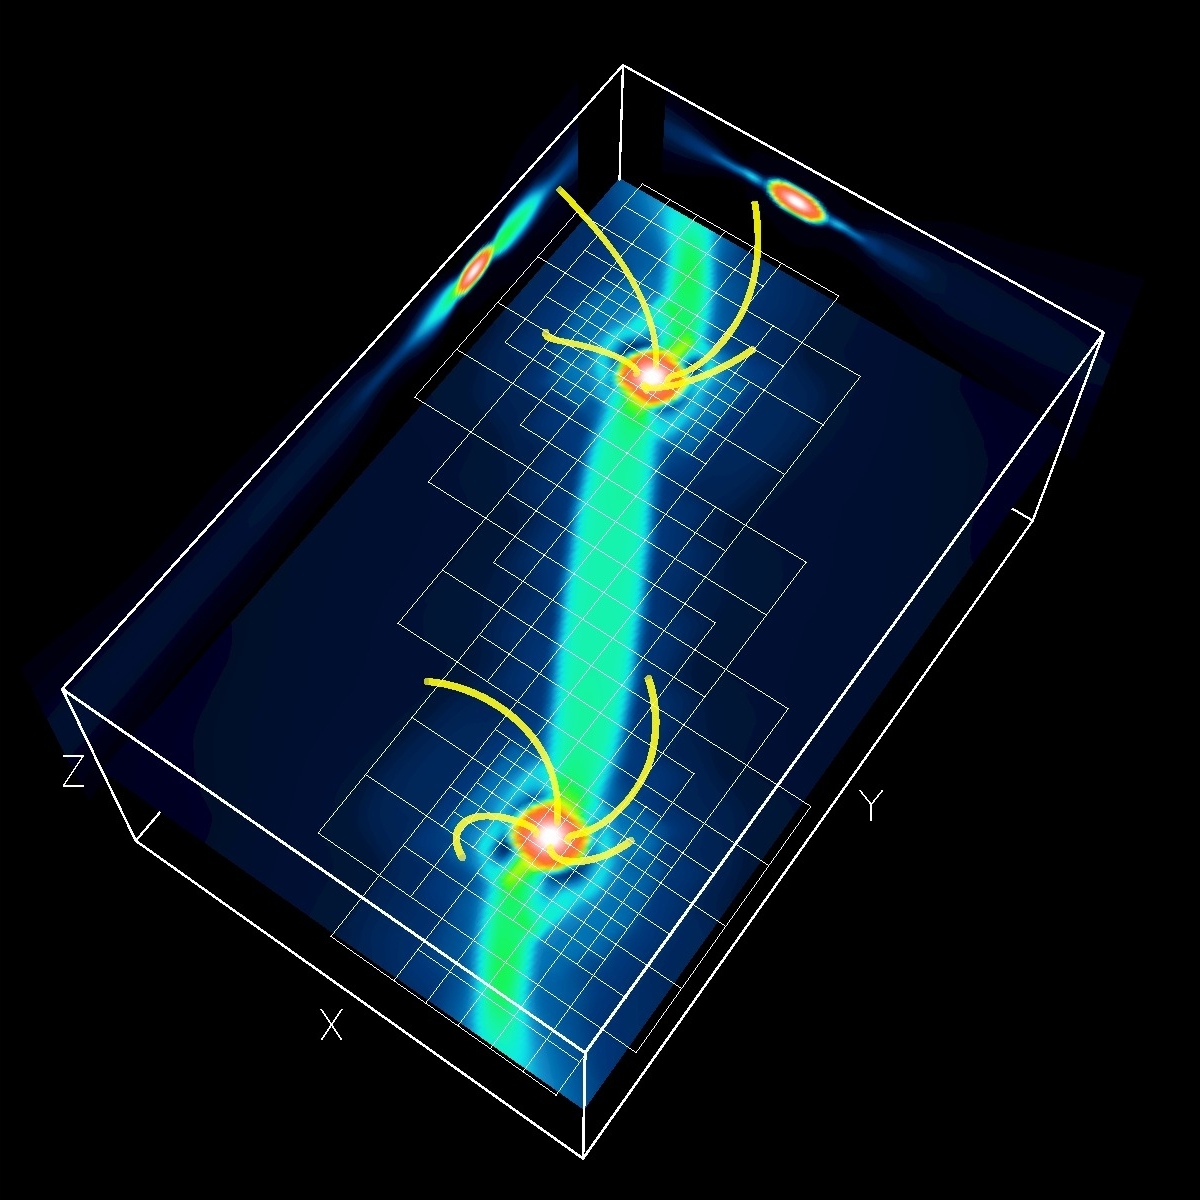
Sternentstehung: Dichteverteilung nach einem barotropen Kollaps mit Magnetfeld.
Star formation: Density structure of a barotropic collapse with magnetic field, computed with NIRVANA3. The MHD computer code features adaptive mesh refinement and self-gravitation.
Graph: U. Ziegler
more at /highlight_archive/ziegler_amr/ziegler_selfgrav.pdf (image added 2005-07-07) |
|
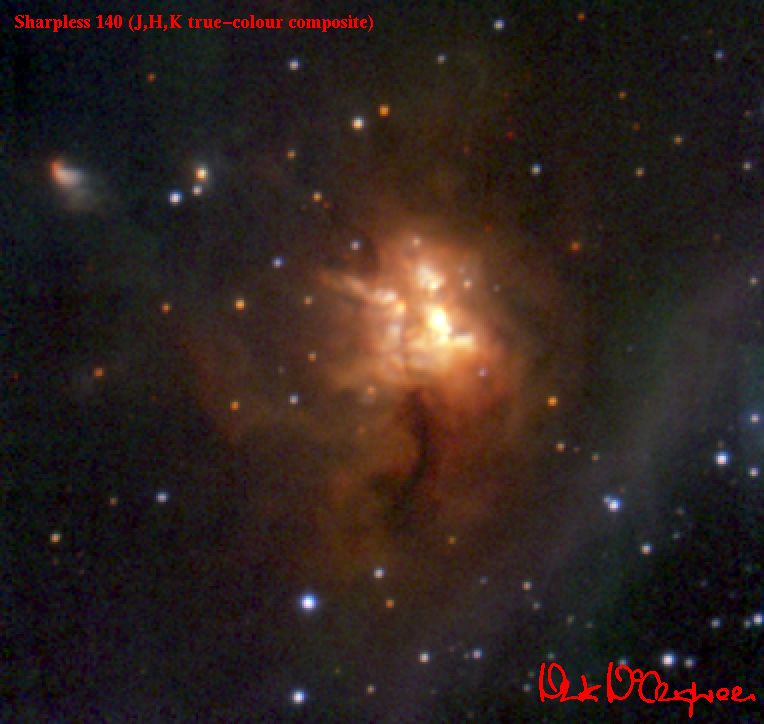
True-colour (J,H,K) near-infrared image of Sharpless 140. J-, H-, and K-band data taken in October 1994 using the 256x256 pixel University of Hawaii infrared camera on the UH 88 inch telescope on Mauna Kea, Hawaii. Image is a 24-bit combination of three individual broad-band near-infrared images (each one a mosaic of many sub-images), namely J-band (1-1.3 microns, blue), H-band (1.4-1.8 microns, green), and K-band (2.0-2.4 microns, red).
Credit: Mark McCaughrean (Astrophysikalisches Institut Potsdam) and John Rayner (University of Hawaii).
more at http://www.aip.de/groups/starplan/mark.html (image added 2002-12-04) |
|
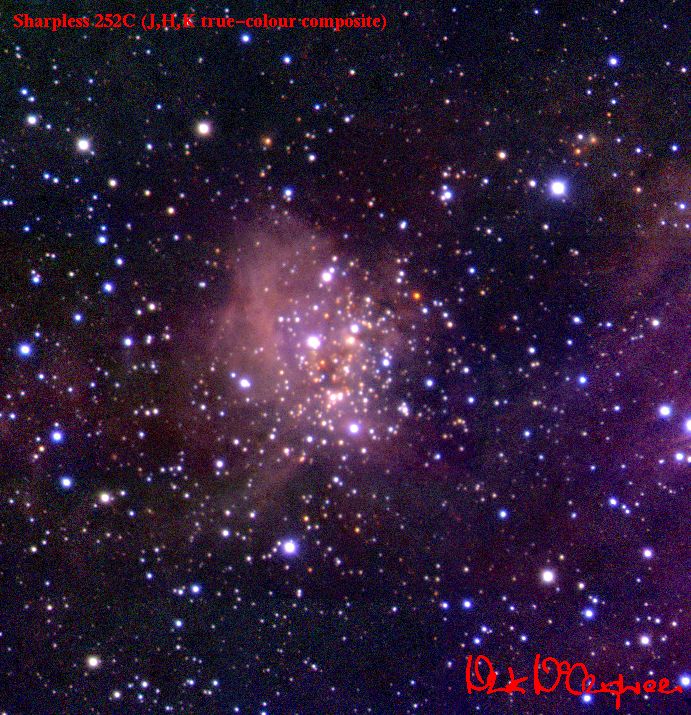
True-colour (J,H,K) near-infrared image of Sharpless 252C. North up, east left. J-, H-, and K-band data taken in January 1993 using the 256x256 pixel MAGIC infrared camera on the Calar Alto 3.5-m telescope in Spain. Image is a 24-bit combination of three individual broad-band near-infrared images (each one a mosaic of many sub-images), namely J-band (1-1.3 microns, blue), H-band (1.4-1.8 microns, green), and K-band (2.0-2.4 microns, red).
This image appeared on the front cover of the ???? 1993 issue of Sterne und Weltraum magazine.
Credit: Mark McCaughrean (Astrophysikalisches Institut Potsdam).
more at http://www.aip.de/groups/starplan/mark.html (image added 2002-12-04) |
|
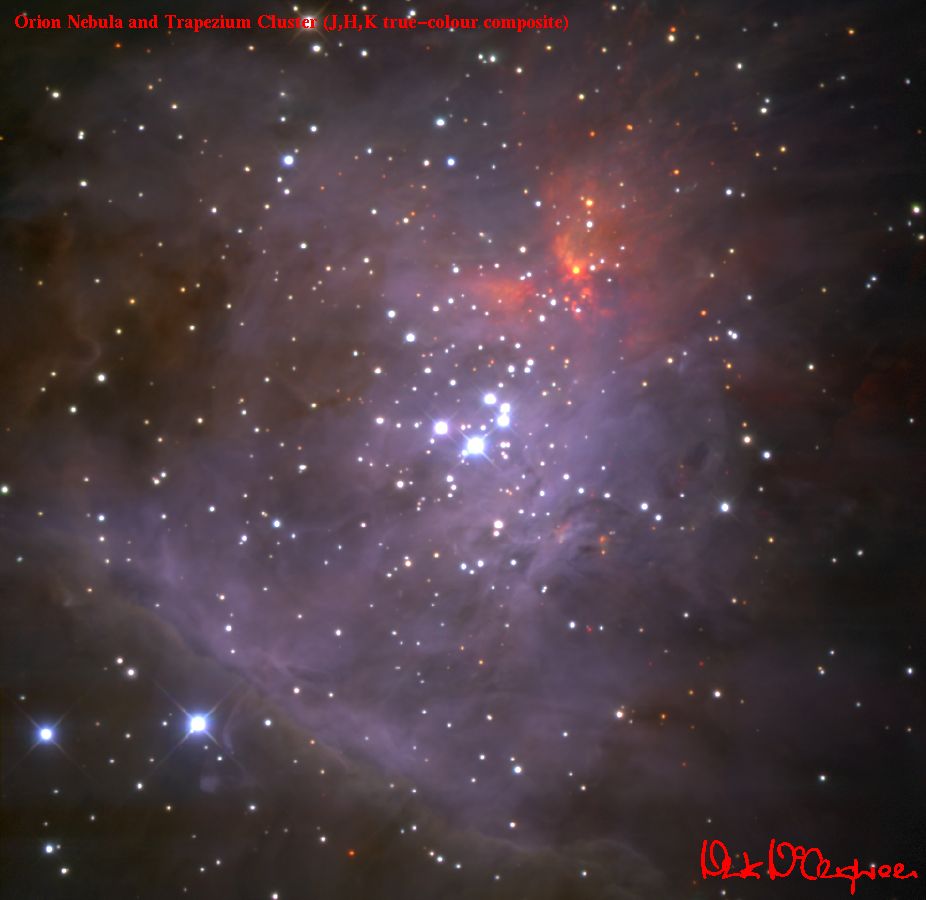
True-colour (J,H,K) near-infrared image of the Orion Nebula and Trapezium Cluster. Field-of-view 5x5 arcmin (0.65x0.65pc at 450pc). North up, east left. J-, H-, and K-band data taken in January 1994 using the 256x256 pixel MAGIC infrared camera on the Calar Alto 3.5-m telescope in Spain. Image is a 24-bit combination of three individual broad-band near-infrared images (each one a mosaic of many sub-images), namely J-band (1-1.3 microns, blue), H-band (1.4-1.8 microns, green), and K-band (2.0-2.4 microns, red).
This image appeared in an article in the ???? November 1996 issue of Science News magazine, in an article in the ???? 1996 issue of National Geographic magazine, and in the book Protosterne by Surdin and Lamzin (Johann Ambrosius Barth Verlag).
Credit: Mark McCaughrean (Astrophysikalisches Institut Potsdam).
more at http://www.aip.de/groups/starplan/mark.html (image added 2002-12-04) |
|
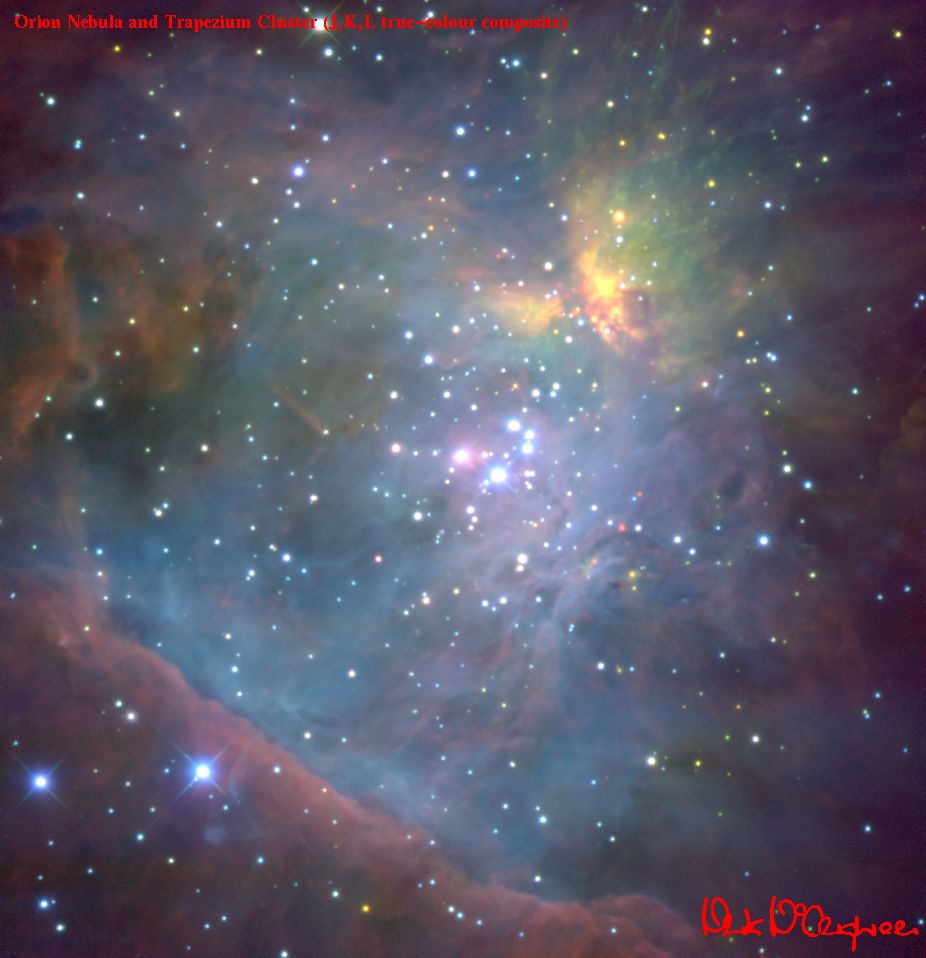
True-colour (J,K,L) near-infrared image of the Orion Nebula and Trapezium Cluster. Field-of-view 5x5 arcmin (0.65x0.65pc at 450pc). North up, east left. J- and K-band data taken in January 1994 using the 256x256 pixel MAGIC infrared camera on the Calar Alto 3.5-m telescope in Spain; L-band data taken in December 1994 using the 256x256 pixel NSFCAM infrared camera on the NASA Infrared Telescope Facility in Hawaii. Image is a 24-bit combination of three individual broad-band near-infrared images (each one a mosaic of many sub-images), namely J-band (1-1.3 microns, blue), K-band (2.0-2.4 microns, green), and L-band (3.2-3.6 microns, red).
Credit: Mark McCaughrean (Astrophysikalisches Institut Potsdam) and John Rayner (University of Hawaii).
more at http://www.aip.de/groups/starplan/mark.html (image added 2002-12-04) |
|
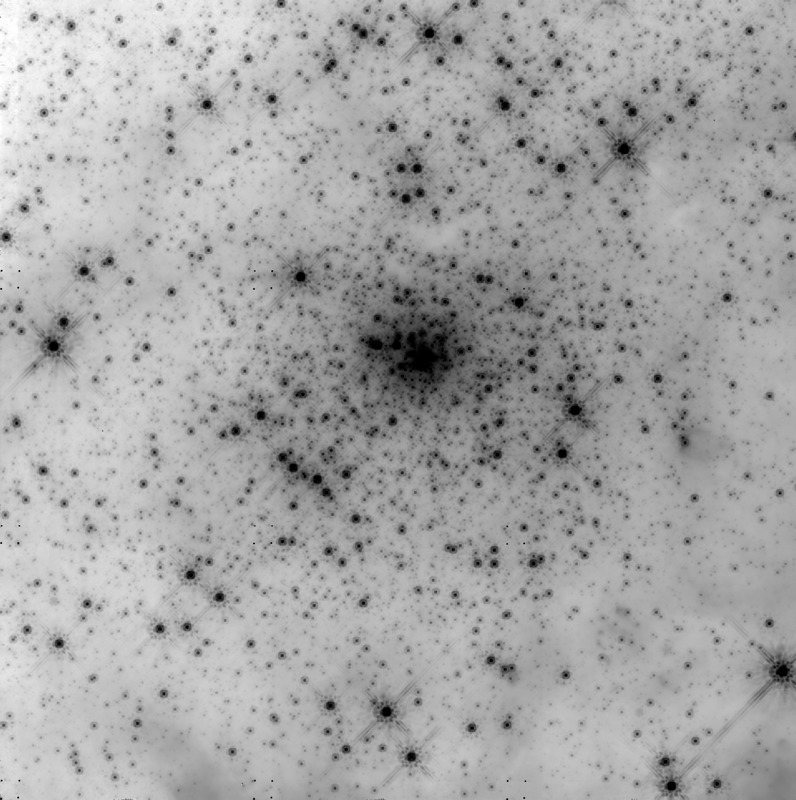
The luminosity function of the center of 30 Doradus
The 30 Dor cluster, also known as NGC 2070, is a very
massive young stellar cluster located in the Large Magellanic Cloud, mor massive
than young star forming clusters within the Galaxy.
To find the number of low mass stars in the center of 30 Dor, very deep
HST/NICMOS H band data has been obtained covering the central 1 square
arc minute of the cluster.
credits: Morten Andersen
[web size] [full size]
more at http://www.aip.de/groups/starplan/ (image added 2002-12-10) |
|
Luminosity function of low mass stars in 30 Doradus
See image above. Separation into 4 annuli is done, since
there is a large difference in crowding as a function of distance from the center.
After correcting for incompleteness, there is no evidence for any flattening
of the H band luminosity function (HLF) down to the completeness limit in any of
the radial bins. The slope of the HLF is 0.30-0.35 in the four plots.
credits: Morten Andersen
more at http://www.aip.de/groups/starplan/ (image added 2002-12-10) |
|
Global accretion-disk simulations
High luminosity and short time-scales of variability are typical for disks which collect matter from the surroundings to accrete the gas and dust onto a central object. The efficiency of that transport requires turbulence in the disk. Searches for instabilities in such accretion disks revealed the magneto-rotational instability as a powerful mechanism in a wide range of objects (protostellar disks, cataclysmic binaries, active galactic nuclei): A weak magnetic fields threads a differentially rotating disk and excites an instability.
The global simulation of such disk configurations on a computer are a challenge for modern computational astrophysics. The image shows five horizontal slices through a simulated accretion disk at five different height levels. The middle slice is the equatorial plane. The colour shading represents the density.
The tubulent flows in the simulated disks turn out to provide powerful transport as required to match the observed phe nomena. Additional generation of strong, large-scale magnetic fields may further illuminate our understanding of what is called dynamo action and the launch of collimated outflows (jets) from the disk as observed in protostellar disks and active galactic nuclei.
(credits: R. Arlt, G. R�diger)
more at http://www.aip.de/~rarlt/ (image added 2002-12-04) |
|
Magnetic star-disk interaction
A classical T Tauri star is a pre-main sequence star surrounded by an accretion disk. Magnetic fields are thought to play a crucial part in the angular momentum evolution of the star. They can directly transfer angular momentum between star and disk, and also drive outflows. Computer simulations show how an initially dipolar field interacts with the accretion disk.
The images show the density distribution, magnetic field lines (solid lines), and gas motion (velocity vectors) in the volume surrounding the star. The left margin of each image is the stellar rotation axis. The left picture shows the initial configuration, the right picture the state that has evolved after about 100 orbits of the inner boundary of the disk. The original dipole is wound up due to the different rotation rates of the footpoints of each field line. The resulting magnetocentrifugal force drives part of the gas outwards and the dipole is replaced with an open field line configuration.
by courtesy of Manfred Küker
more at http://www.aip.de/groups/MHD/ (image added 2002-12-04) |
|
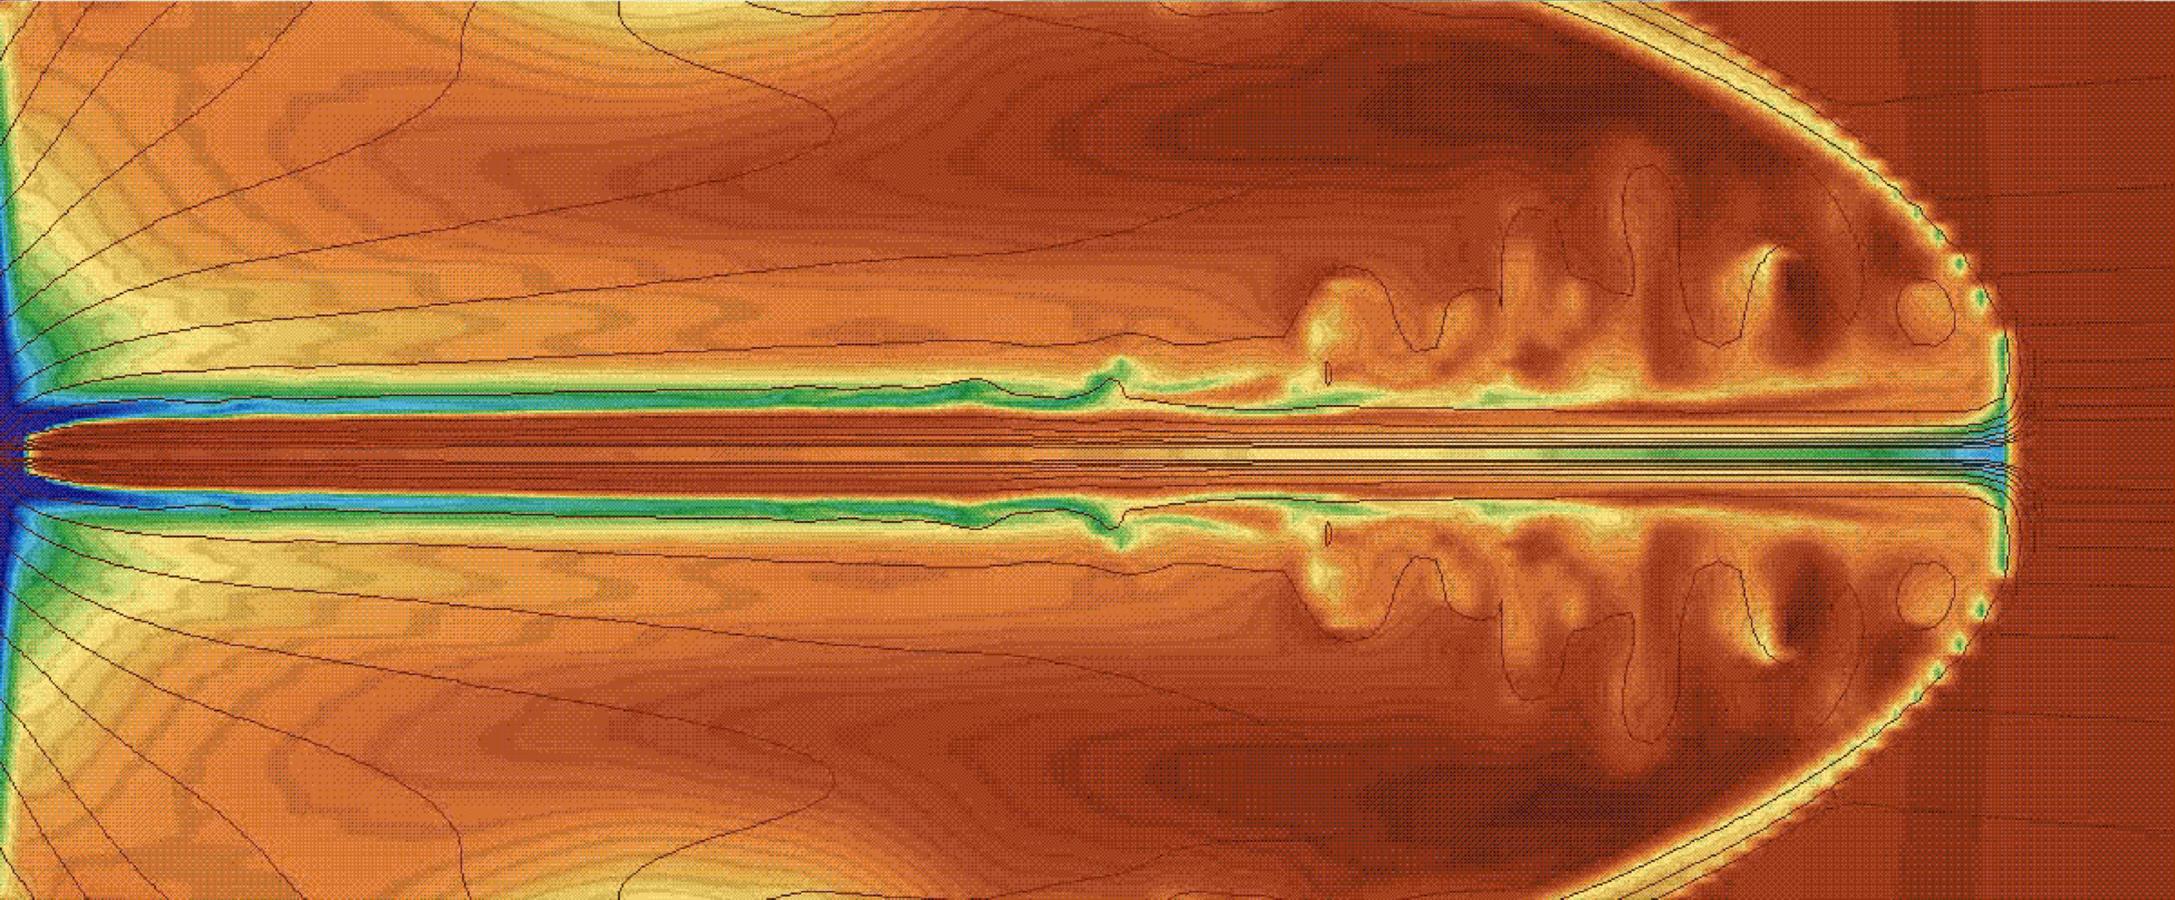
Numerical simulation of a magnetically driven outflow (jet)
Jets are ejected from young stellar objects as well from
active galactic nuclei. The matter being accelerated
originates from the disk around the star/black hole
accreting matter from the surroundings.
Colours indicate density, increasing from blue to yellow.
The numerical resolution is 900 times 200 grid cells.
Lines denote twenty linearly spaced magnetic flux surfaces
The jet is shown after 400 rotations of the underlying
accretion disk.
credits: M. Cemeljic
more at http://www.aip.de/groups/MHD/ (image added 2002-12-10) |
|
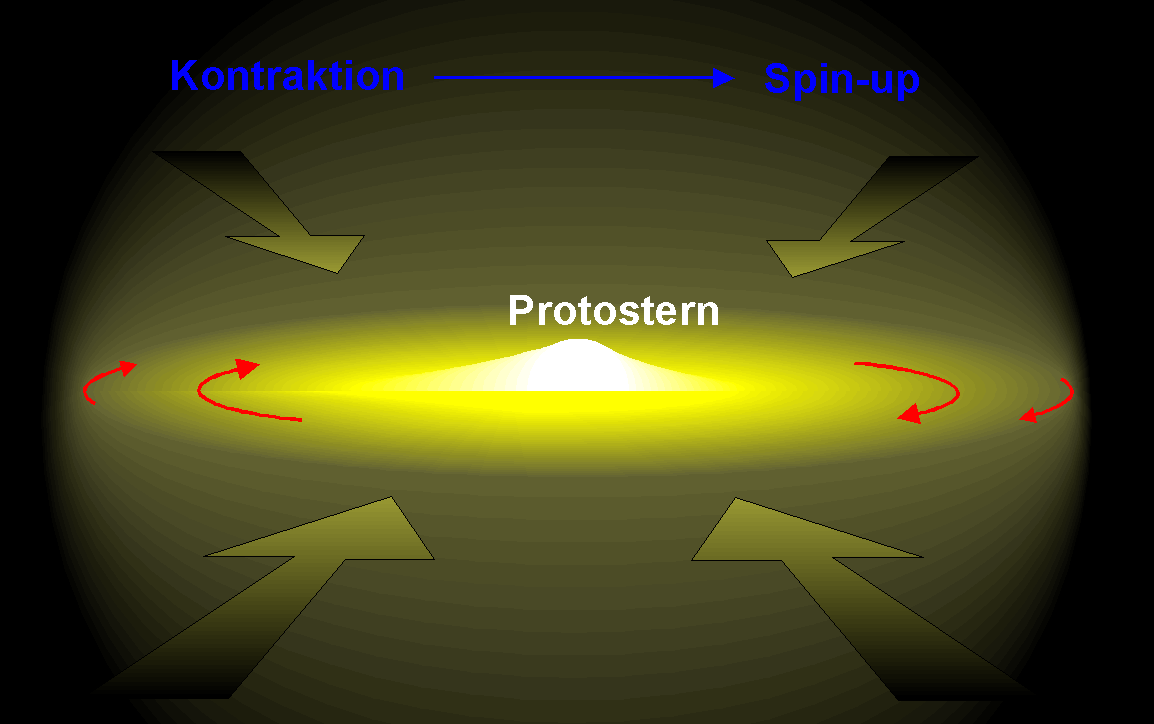
Skizze der Sternentstehung im Scheibenstadium. Materie
wird aus der Umgebung aus dem Kern der Moleküwolke
gezogen. Die differentielle Rotation der Akkretionsscheibe
ist durch rote Pfeile angedeutet. Die Kontraktion des Objekt
führt zum Wachsen der Rotationsgeschwindigkeit. Zur
Bildung eines etwa kugelförmigen Sterns muss Drehimpuls
aus dem Innern abgeführt werden.
R. Arlt
more at http://www.aip.de/~rarlt/ (image added 2003-01-16) |
|
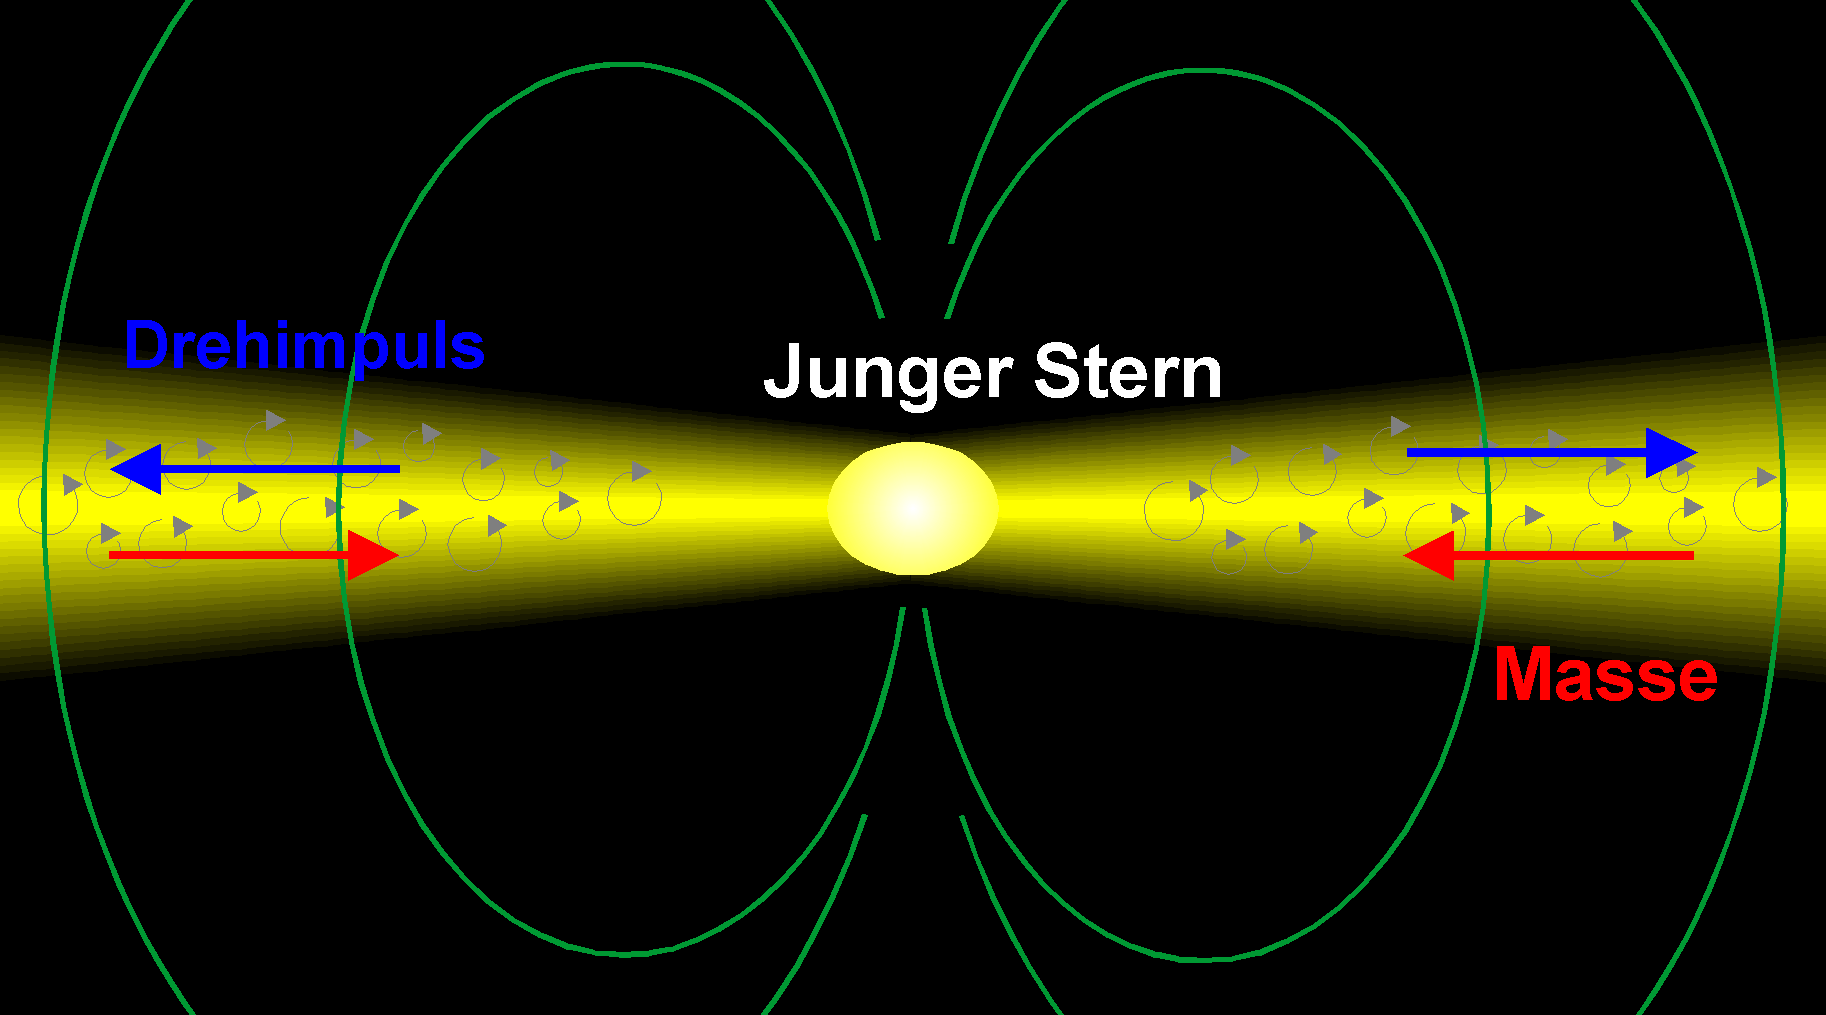
Der zur Sternentstehung nötige Drehimpulstransport kann durch
turbulente Bewegung bewerkstelligt werden (Kringel). Dann kann
sich Masse nach innen bewegen und den Protostern bereichern.
Dafür geeignete Turbulenz kann durch Magnetfelder
erzeugt werden, die die Scheibe durchdringen (grüne Linien).
R. Arlt
more at http://www.aip.de/~rarlt/ (image added 2003-01-16) |

 last change Sat, 12 Mar 2011 11:52:50 GMT, U. Hanschur


![[full size]](images/klessen_star_form_galaxy_xl.gif)
![[full size]](images/kueker_funnel_flow_xl.gif)
![[full size]](images/mandersen_xl.jpg)