
 |
|
|
 |
|
|
|
| last change Sat, 12 Mar 2011 11:52:50 GMT, U. Hanschur |
|
 |
 |
 |
 |
Sun: Corona |
 |
 |
 |
 |
 |
| Back to image index |
|
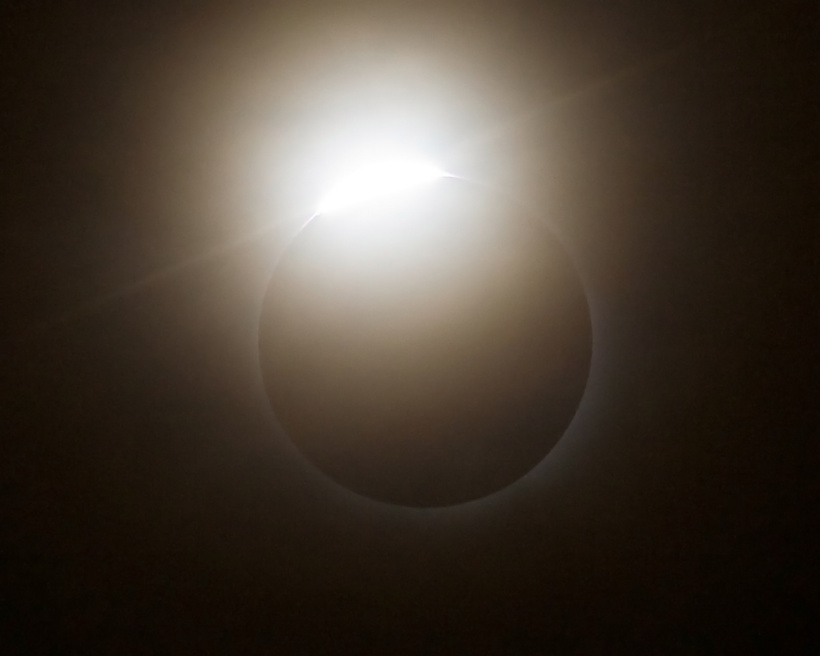
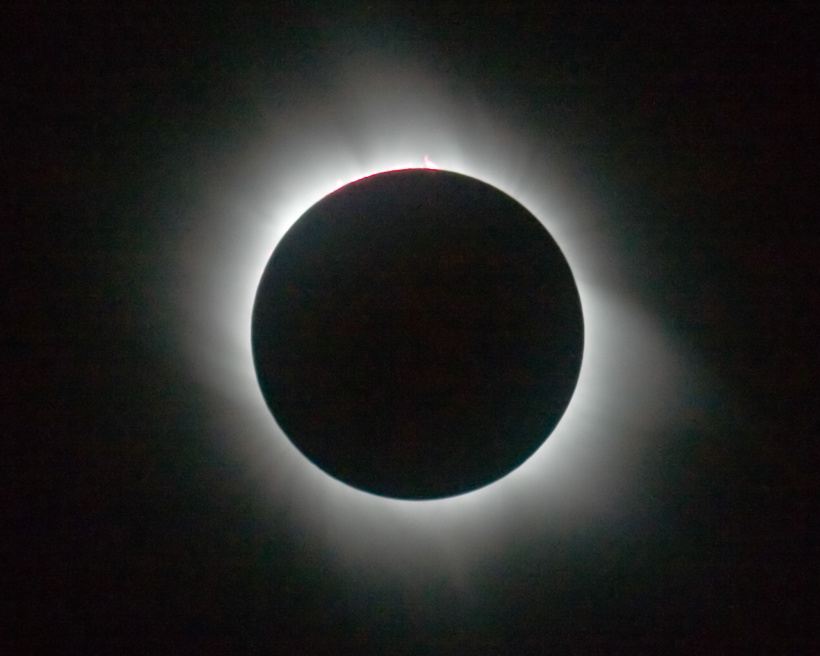
Totale Sonnenfinsternis am 29.3.2006, 40 km östlich von Antalya.
Total solar eclipse, Mar 29, 2006, 40km east of Antalya.
Photo: R. Arlt
[web size] [full size]
more at /People/rarlt/eclipse2006/ (image added 2006-04-06) |
|
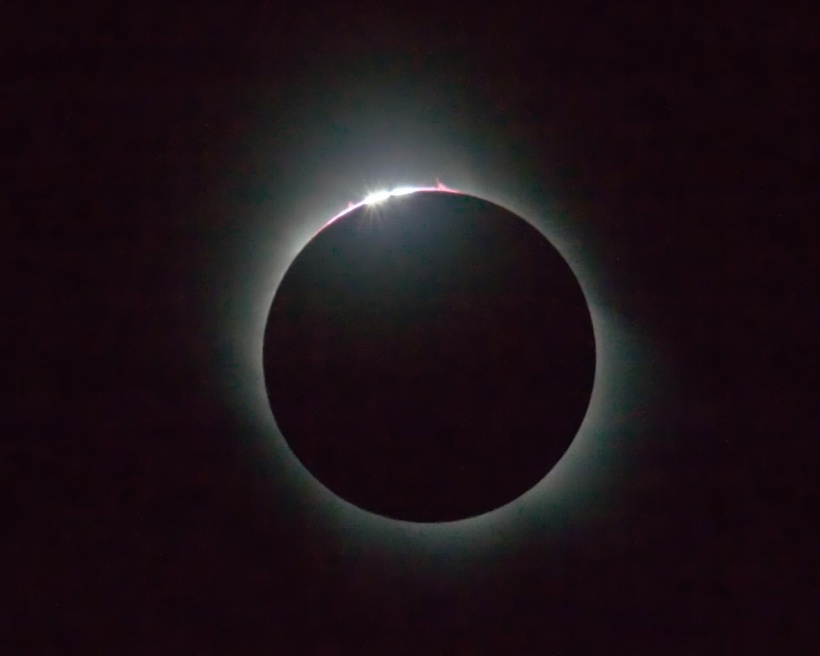
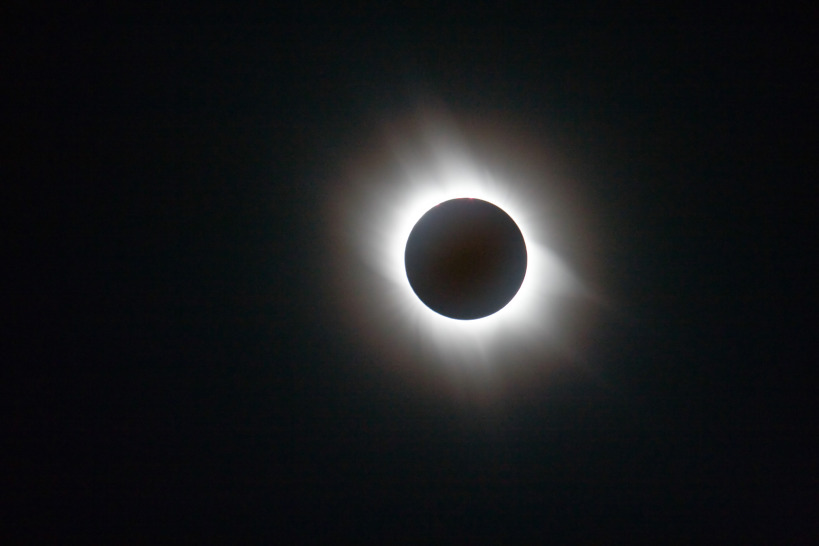
Totale Sonnenfinsternis am 29.3.2006, 40 km östlich von Antalya.
Total solar eclipse, Mar 29, 2006, 40km east of Antalya.
Photo: R. Arlt
[web size] [full size]
more at /People/rarlt/eclipse2006/ (image added 2006-04-06) |
|
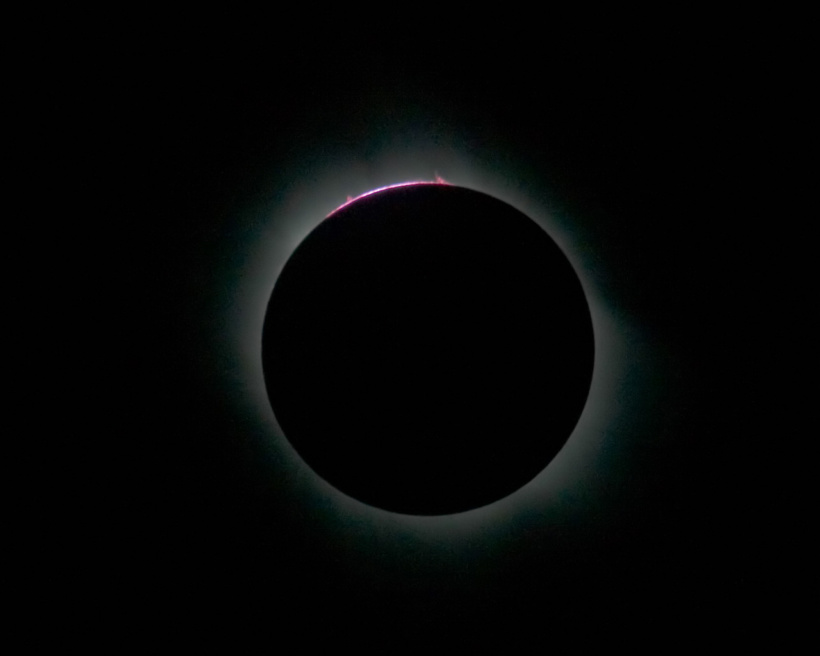
Totale Sonnenfinsternis am 29.3.2006, 40 km östlich von Antalya.
Total solar eclipse, Mar 29, 2006, 40km east of Antalya.
Photo: R. Arlt
[web size] [full size]
more at /People/rarlt/eclipse2006/ (image added 2006-04-06) |
|
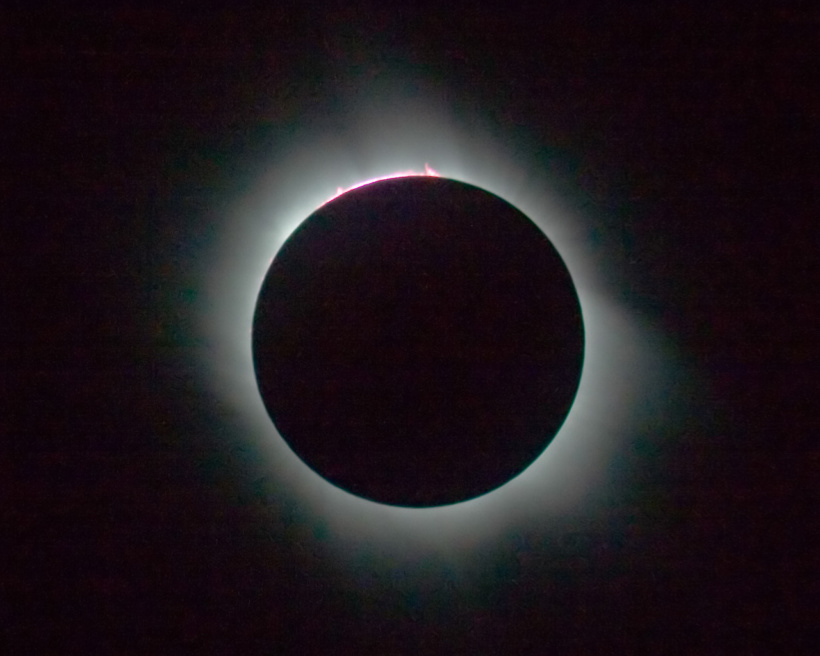
Totale Sonnenfinsternis am 29.3.2006, 40 km östlich von Antalya.
Total solar eclipse, Mar 29, 2006, 40km east of Antalya.
Photo: R. Arlt
[web size] [full size]
more at /People/rarlt/eclipse2006/ (image added 2006-04-06) |
|
Totale Sonnenfinsternis am 29.3.2006, 40 km östlich von Antalya.
Total solar eclipse, Mar 29, 2006, 40km east of Antalya.
Photo: R. Arlt
[web size] [full size]
more at /People/rarlt/eclipse2006/ (image added 2006-04-06) |
|
Totale Sonnenfinsternis am 29.3.2006, 40 km östlich von Antalya.
Total solar eclipse, Mar 29, 2006, 40km east of Antalya.
Photo: R. Arlt
[web size] [full size]
more at /People/rarlt/eclipse2006/ (image added 2006-04-06) |
|
Kinematics of the coronal wave of 2003 Nov 3. The distances d(t) of the wavefronts are plotted together with a polynomial fit. Distances are given in Mm (10^3 km). SXI, EIT, and H-alpha data are considered. Also included is the hard X-ray lightcurve (red) of the associated flare as measured by the RHESSI satellite.
Graph: A. Warmuth
[web size] [full size]
more at /groups/osra/ (image added 2006-02-02) |
|
 |
 |
 |
 |
|
|
![[full size]](images/eclipse_7627_xl.jpg)
![[full size]](images/eclipse_7630_xl.jpg)
![[full size]](images/eclipse_7631_xl.jpg)
![[full size]](images/eclipse_7632_xl.jpg)
![[full size]](images/eclipse_7633_xl.jpg)
![[full size]](images/eclipse_7637_xl.jpg)
![[full size]](images/warmuth_wavefront_xl.gif)