| Back to image index |
|
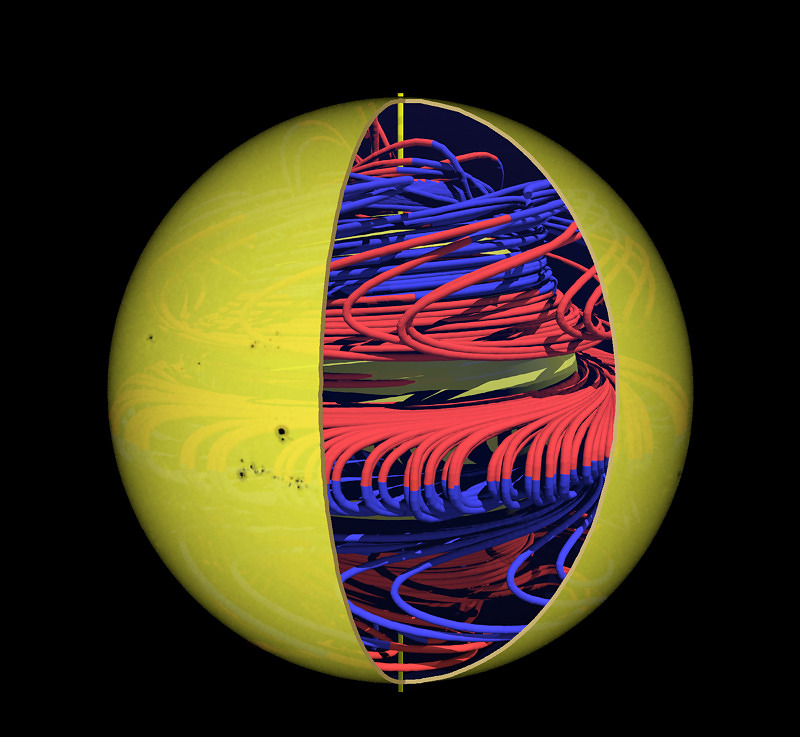
Magnetfelder im Innern der Sonne nach einem Mean-Field-Modell. Die Oberflähe zeigt tatsählich beobachtete Sonnenflecken.
Magnetic fields in the solar interior according to a mean-field model. Th surface shows sunspots from a real observation.
Grafik und Modell: R. Arlt
[web size] [full size]
more at /highlight_archive/iaus259/ (image added 2008-11-11) |
|
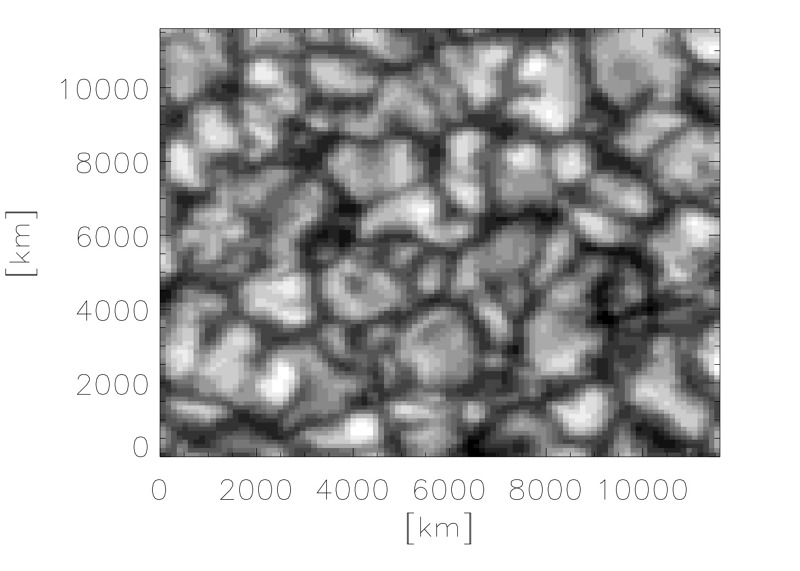
Solar 3D tomography with Hinode: continuum intensity of the analyzed
quiet photospheric region.
Graph: T. Carroll, M. Kopf
[web size] [full size]
more at /highlight_archive/carroll_hinode/ (image added 2008-06-25) |
|
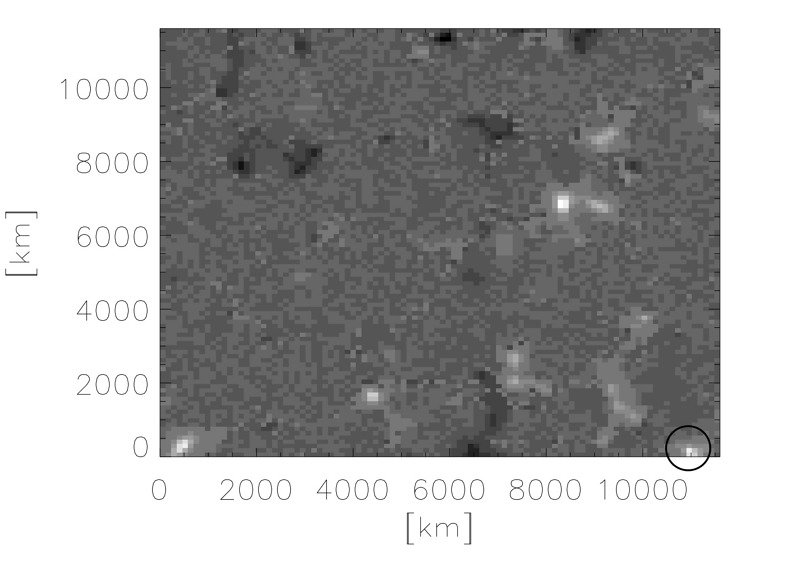
Solar 3D tomography with Hinode: apparent flux density
obtained directly from the measured polarimetric profiles.
The circle indicates a strong magnetic field structure.
Graph: T. Carroll, M. Kopf
[web size] [full size]
more at /highlight_archive/carroll_hinode/ (image added 2008-06-25) |
|
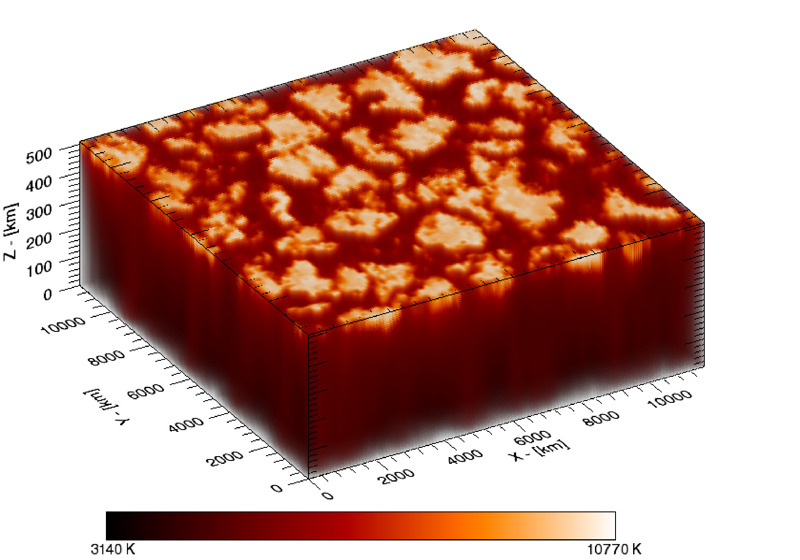
Solar 3D tomography with Hinode: 3-dimensional reconstruction of the temperature
for the observed FOV in a bottom-up-view (deepest layer on top) to
emphasize the rich structuring in the lower photosphere.
Red/Orange colors indicate the hot granular regions while the dark colors
show the cooler intergranular lanes.
Graph: T. Carroll, M. Kopf
[web size] [full size]
more at /highlight_archive/carroll_hinode/ (image added 2008-06-25) |
|
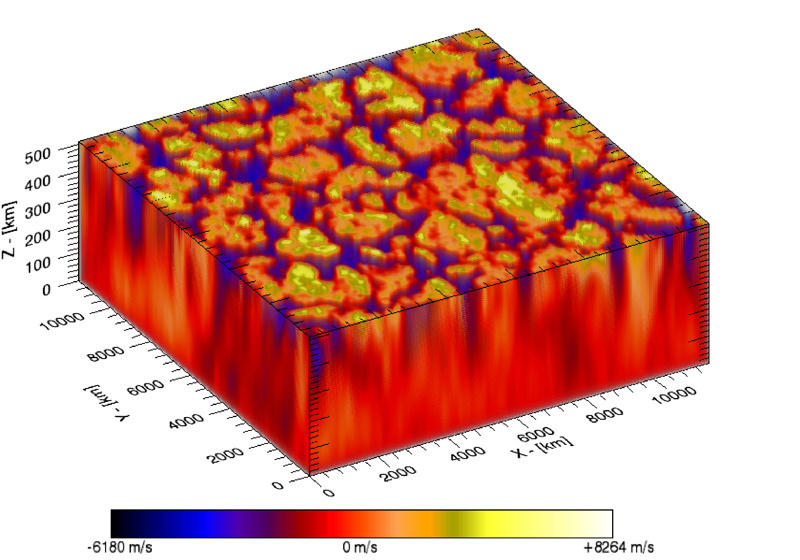
Solar 3D tomography with Hinode: line-of-sight velocity for the reconstructed volume also
in a bottom-up-view. Bright color represent upflows and dark colors the downflows in the
intergranular regions. One nicely can identify the onset of strong
downflows in the mid photosphere, please note again the bottom up
representation.
Graph: T. Carroll, M. Kopf
[web size] [full size]
more at /highlight_archive/carroll_hinode/ (image added 2008-06-25) |
|
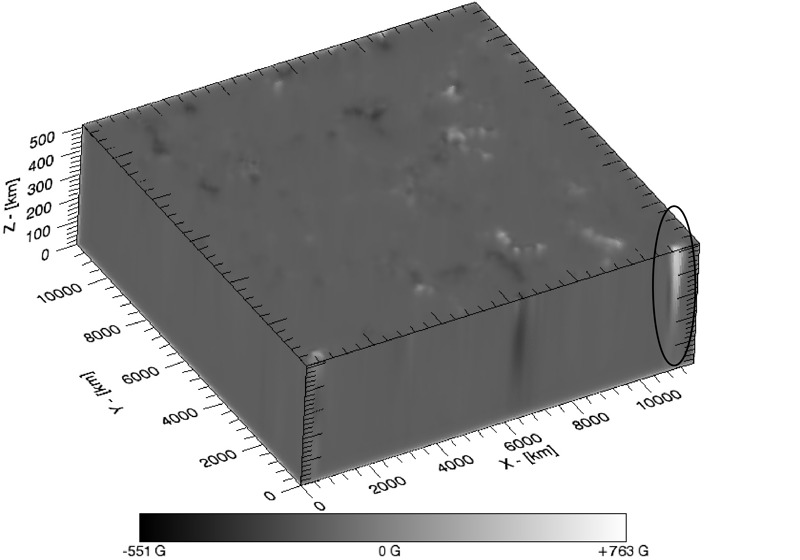
Solar 3D tomography with Hinode: 3-dimensional reconstruction
of line-of-sight magnetic field for the FOV (bottom up).
Black and white represent the different magnetic polarities. This figure also
provides a nice slice view of at least 3 magnetic structures in the
front plane (X-Z plane).
Graph: T. Carroll, M. Kopf
[web size] [full size]
more at /highlight_archive/carroll_hinode/ (image added 2008-06-25) |
|
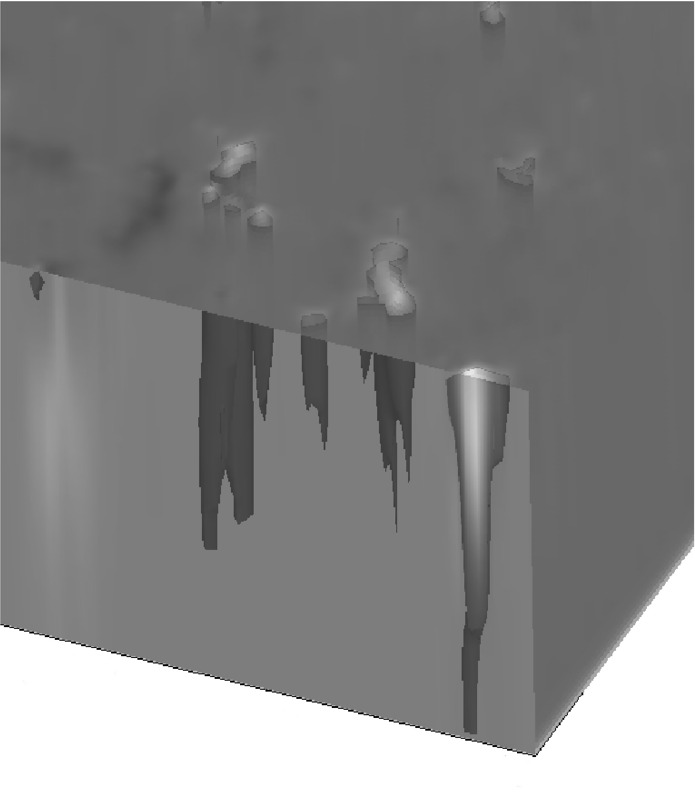
Solar 3D tomography with Hinode: close up views of magnetic structures
(bottom view). To allow a better "insight" into the 3-dimensional structure,
the side walls are made transparent. Iso-surface of 175 Gauss field strength are shown from which
one can identify many small scale "tube-like" magnetic structures.
Graph: T. Carroll, M. Kopf
[web size] [full size]
more at /highlight_archive/carroll_hinode/ (image added 2008-06-25) |
|
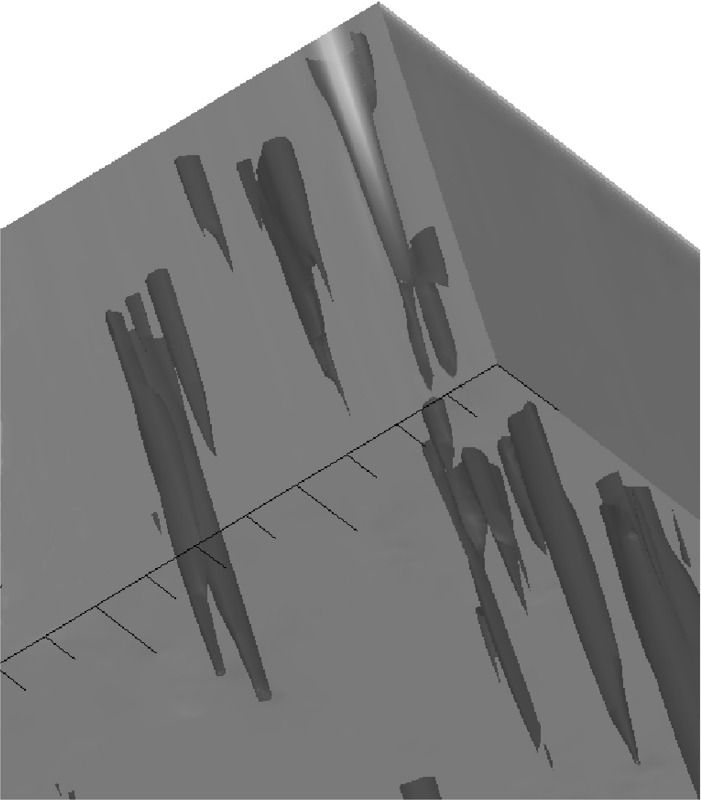
Solar 3D tomography with Hinode: close up views of magnetic structures
(bottom view). To allow a better "insight" into the 3-dimensional structure,
the side walls are made transparent. Iso-surface of 175 Gauss field strength are shown from which
one can identify many small scale "tube-like" magnetic structures.
Graph: T. Carroll, M. Kopf
[web size] [full size]
more at /highlight_archive/carroll_hinode/ (image added 2008-06-25) |

 last change Sat, 12 Mar 2011 11:52:50 GMT, U. Hanschur


![[full size]](images/sun_withdynamo_xl.jpg)
![[full size]](images/carroll_1a_intensity_xl.jpg)
![[full size]](images/carroll_1b_flux_xl.jpg)
![[full size]](images/carroll_2_temp_xl.jpg)
![[full size]](images/carroll_3_vel_xl.jpg)
![[full size]](images/carroll_4_magn_xl.jpg)
![[full size]](images/carroll_5_closeup1_xl.jpg)
![[full size]](images/carroll_5_closeup2_xl.jpg)