| Back to image index |
|
A typical part of a patch of fiber bursts in the dynamical radio spectrum of 28 October 2003. The image shows the spectrum's temporal derivative. The data were recorded by the Observatory of Solar Radioastronomy of the Astrophysical Institute Potsdam.
Graph: C. Vocks
[web size] [full size]
more at /groups/osra/ (image added 2006-02-02) |
|
Growth rates for whistler waves as a function of wave frequency, omega_r, and propagation angle, theta, normalized to the electron gyrofrequency, Omega_e. The wave growth is strongest for waves propagating parallel to the background magnetic field.
Graph: C. Vocks
[web size] [full size]
more at /groups/osra/ (image added 2006-02-02) |
|
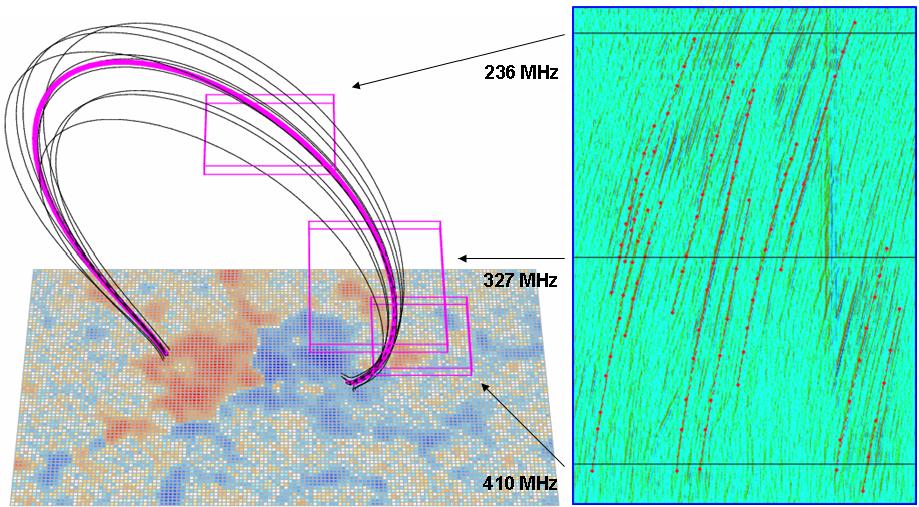
Example demonstrating the combination of radio and optical observations for field determination. Right panel: AIP radio spectrum with fiber bursts. The abscissa is the time (60 s) and the ordinate is the observing frequency corresponding (via a coronal electron density model) with the height above the photosphere. Left panel: Part of a SOHO-MDI magnetogram, red and blue: magnetic north and south polarity. Thin arcs: magnetic field lines passing all fiber burst source sites (the boxes assigned by arrows with the observing frequency). Thick line (magneta): the average fiber burst field line for a certain time interval during the flare.
Graph: G. Rausche
more at /groups/osra/ (image added 2006-02-02) |
|
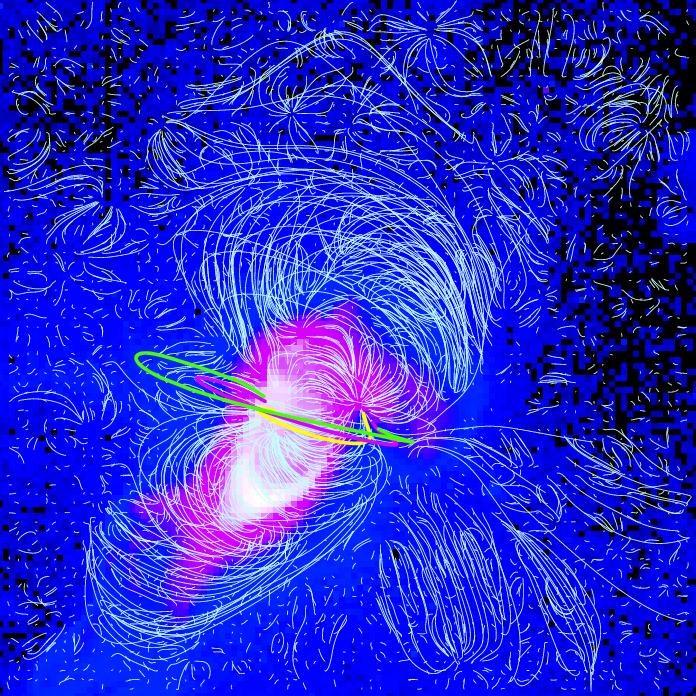
07 April 1997: YOHKOH soft X-ray image of the flaring active region (N--upwards, W--to the right) with superposed potential field lines (grey) and overplotted flare-activated field lines. Yellow line - 10 min after flare start, magenta - 30 min, green - 40 min after onset.
Graph: H. Aurass, G. Rausche
more at /groups/osra/ (image added 2006-02-02) |
|
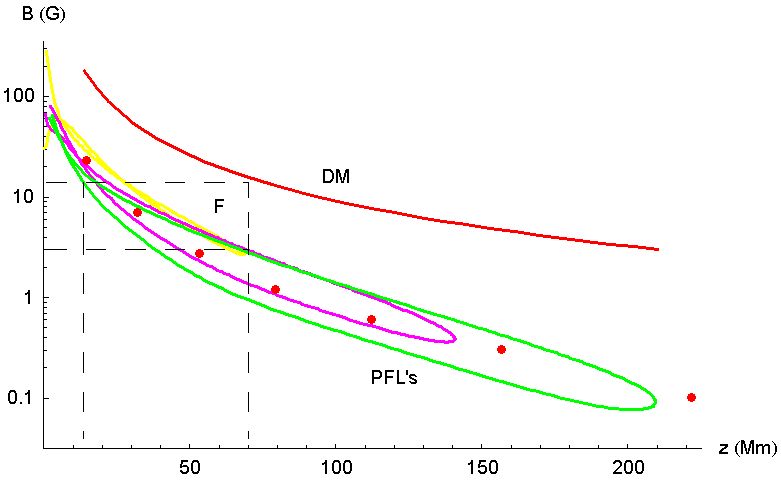
07 April 1997: Measured coronal magnetic field strength along the flare-activated field lines (PFL) versus height over the photosphere. Yellow line - 10 min after flare start, magenta - 30 min, green - 40 min after onset. The red curve (DM) is the mean active region magnetic field after Dulk and McLean's model. Dotted is the average field strength in the active region.
Graph: H. Aurass, G. Rausche
more at /groups/osra/ (image added 2006-02-02) |
|
OSRA: Temporal behavior of the gamma-ray fluxes in the range of 7.5-10 MeV (top) during the initial phase of the flare as measured by the SPI instrument aboard INTEGRAL. The corresponding dynamic radio spectrum (200-400 MHz) taken in Tremsdorf shows typical signatures of a standing shock wave, i.e. the termination shock.
Graph: G. Mann
[web size] [full size]
more at /groups/osra/ (image added 2006-02-02) |
|
Solar radio physics: Magnetic configuration under an eruptive prominence (EP). Magnetic reconnection takes place at the diffusion region (DR), where jets (J) of hot plasma are shooting away. Due to the deceleration of such a jet a termination shock (TS) is established above the postflare loops (PFL).
Graph: A. Warmuth
[web size] [full size]
more at /groups/osra/ (image added 2006-02-02) |
|
Intensity map of a large sunspot observed on 19 June 2001 with the Tenerife Infrared Polarimeter at the German Vacuum Tower Telescope. This image is reconstructed from two spectral scans across the spot using the line Fe I 1089.6 nm. The spot was located at a distance of 8° from disk center.
Graph: H. Balthasar
[web size] [full size]
more at /People/hbalthasar/ (image added 2006-02-01) |
|
Sunspot on 19 June 2001 with the German Vacuum Tower Telescope. Vertical component of the electric current density. Values are clipped at -40 mA/m^2 and 40 mA/m^2 to emphasize the penumbral structures. The contour lines indicate the inner and outer boundaries of the penumbra.
Graph: H. Balthasar
[web size] [full size]
more at /People/hbalthasar/ (image added 2006-02-01) |
|
Kanzelhöhe H-alpha filtergram of AR McMath 13738. The upper bar points to a sunspot of leading polarity. The lower bar points to a location of repeated flaring associated with type III bursts.
[web size] [full size]
more at /groups/soe/descr/science-overv.html (image added 2006-02-01) |
|
Extrapolation of the photosperic longitudinal field magnetogram of AR McMath 13738. There are drawn selected field lines representing some characteristics of the field configuration inside and at the leading edge of the active region.
Graph: A. Hofmann
[web size] [full size]
more at /groups/soe/descr/science-overv.html (image added 2006-02-01) |
|
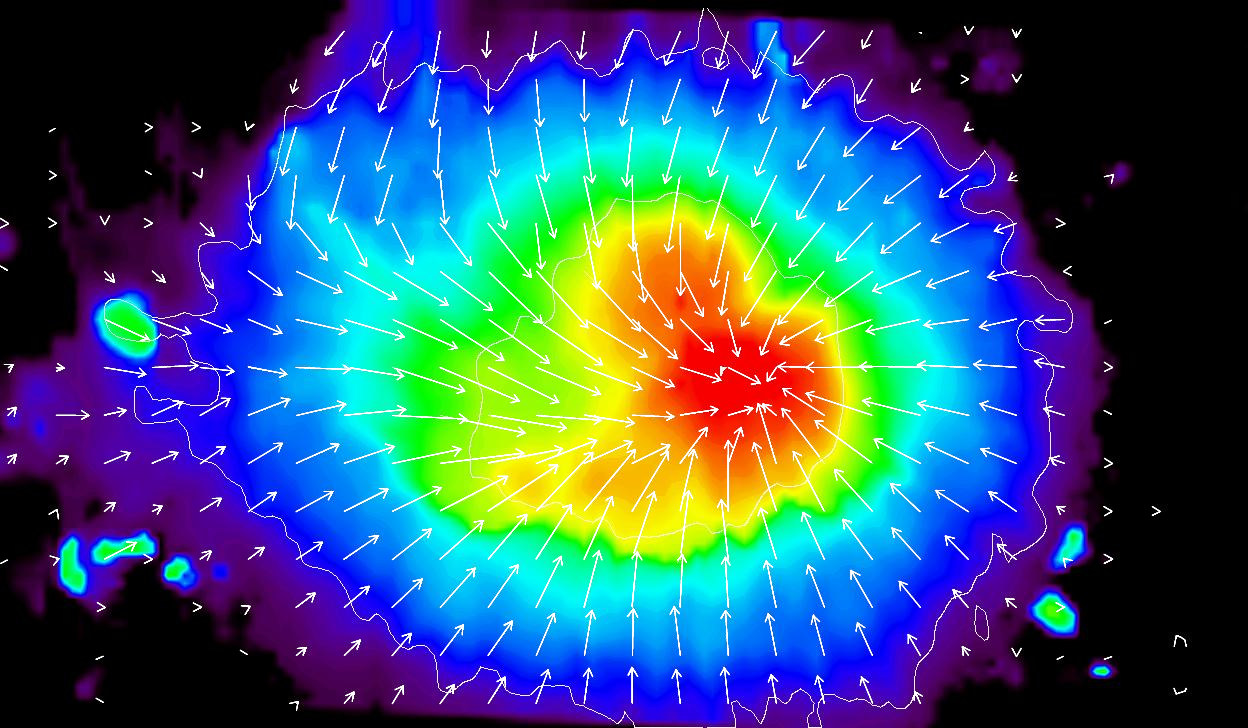
Magnetic field of a sunspot.
The highest field strength of 3000 Gauss (red) occurs in the central umbra. 500 Gauss (blue) are measured in the outer penumbra. Arrows indicate the direction of the horizontal component of the magnetic field. The white contours show the outer edges of umbra and penumbra.
Credits: H. Balthasar
more at http://www.aip.de/~hoba/ (image added 2004-04-01) |
|
This sunspot (active region AR 9169) was the biggest one of the present solar cycle so far. Its extension corresponds to more than 100000 km.
Although we are close to the maximum of this solar cycle, sunspots of this size are rather seldom. Using a protection filter, it was visible for the human eye without telescope. An image of a that large sunspot cannot be obtained at a big solar telescope like the Vacuum Tower Telescope on Tenerife (VTT) in a single exposure; instead several subimages have been taken and put together as a mosaic. A special blue filter centered on 430 nm has been used. For comparison, the size of the whole Earth is given in the image. (credit: H. Balthasar)
more at http://www.aip.de/groups/soe/ (image added 2002-12-05) |
|
Mittelgrosser Sonnenfleck, aufgenommen am 25. Juli 1994 mit dem deutschen Vakuum-Turm-Teleskop (VTT) im spanischen Observatorio del Teide auf Teneriffa. Beobachter: H. Balthasar und H. Schleicher.
Sunspot of medium size, observed on July 25, 1994 with the German Vacuum Tower Telescope (VTT) at the Spanish Observatorio del Teide on Tenerife. Observers: H. Balthasar and H. Schleicher.
more at http://www.aip.de/groups/soe/ (image added 2003-05-09) |
|
Dopplergeschwindigkeitsfeld eines mittelgroßen Sonnenflecks, 25. Juli 1994, deutsches Vakuum-Turm-Teleskop (VTT), Observatorio del Teide, Teneriffa. Der Fleck war etwa 40° von der Scheibenmitte entfernt. Geschwindigkeiten in Richtung des Beobachters sind blau, entgegengerichtete rot dargestellt. Die durchgezogene Linie ist der Umriss des Flecks. Der Pfeil zeigt in Richtung Scheibenzentrum. Beobachter: H. Balthasar und H. Schleicher
Doppler-velocity field of a sunspot of medium size, July 25, 1994, German Vacuum Tower Telescope (VTT), Observatorio del Teide, Tenerife. The spot was about 40° out of disk centre. Velocities towards the observer are shown in blue, the opposite direction in red. The solid line indicates the contour of the spot. The arrow point towards disk centre. Observers: H. Balthasar and H. Schleicher
more at http://www.aip.de/groups/soe/ (image added 2003-05-09) |

 last change Sat, 12 Mar 2011 11:52:50 GMT, U. Hanschur


![[full size]](images/vocks_fiber_burst_xl.gif)
![[full size]](images/vocks_whistler_wave_xl.gif)
![[full size]](images/mann_gamma_osra_xl.gif)
![[full size]](images/mann_acceleration_scheme_xl.gif)
![[full size]](images/balthasar_sunspot_2001_xl.gif)
![[full size]](images/balthasar_current_2001_xl.gif)
![[full size]](images/hofmann_burst_1_xl.gif)
![[full size]](images/hofmann_burst_2_xl.gif)