| Back to image index |
|
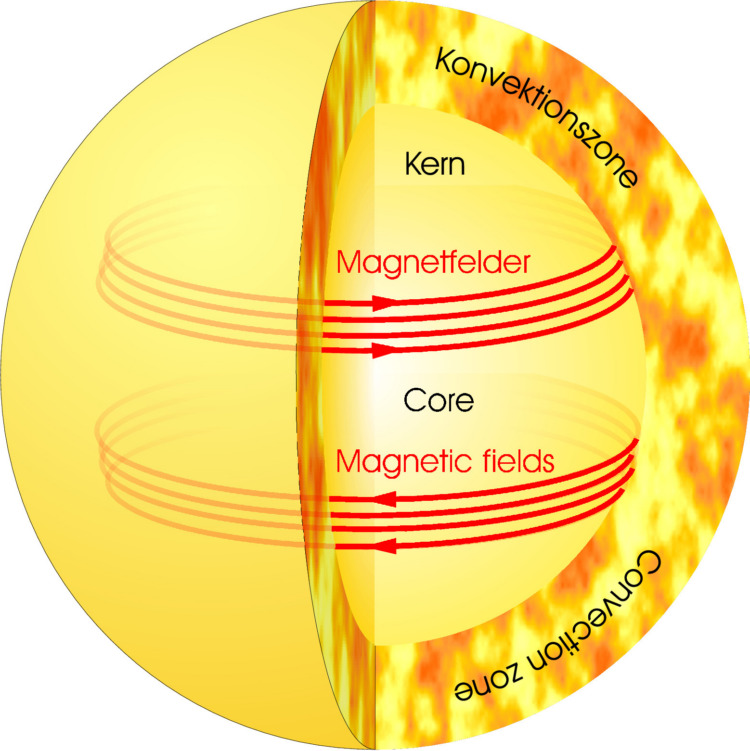
Stability of the solar tachocline: Magnetic field belts are placed below the convection zone in order to study their stability. The belts are indicated by red field lines.
Graph: R. Arlt
[web size] [full size]
more at /groups/MHD/ (image added 2006-01-31) |
|
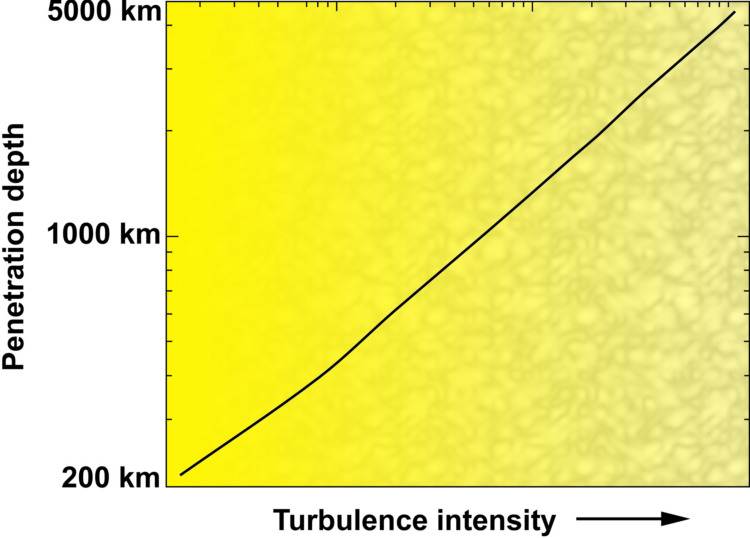
Sun: Penetration depth of the meridional circulation at the transition between convection zone and core, as a function of the turbulence intensity.
Graph: L. Kitchatinov, R. Arlt
[web size] [full size]
more at /groups/MHD/ (image added 2006-01-31) |
|
Huge solar flare disturbes space weather
An extreme case of a solar eruption was observed on October 28, 2003. An X17 flare not far from the central meridian. Flares lead to enhanced emission of electromagnetic waves over a broad spectral range, ejection of high-energy particle streams, and shock waves. Further, they can be associated with coronal mass ejections (CMEs), larg-scale bubbles of coronal matter. If such disturbances hit the magnetospheric shield of the Earth we notice a geoeffective change of "Space weather" (indicated by geomagnetic storms, aurorae, enhanced ionospheric absorption etc.).
The radio emission of solar flares (in our spectrum shown between 40 and 800 MHz) comes from the lower corona above the flaring active region. The strength of the radio flux is color coded, black is strongest. Lines parallel to the time axis are terrestrial transmitters.
H. Aurass
more at http://www.aip.de/highlight_archive/aurass_flare/ (image added 2003-11-20) |
|
Erzeugung von Magnetfeldern in der Sonne
Die gemeinsame Wirkung von Konvektion und differentieller Rotation erzeugt Magnetfelder (rot). Entsprechende Modelle können den magnetischen Aktivitätszyklus der Sonne erklären. Beobachtungen zeigen die periodische Verlagerung der Sonnenfleckenentstehung zum Äquator hin. Baut man in das theoretische Modell eine großskalige meridionale Strömung ein, kann man den Transport der Magnetfeldgürtel zum Äquator hin erklären. (hohe Auflösung).
Graph: R. Arlt
more at http://www.aip.de/~rarlt/medina.pdf (image added 2003-03-19) |
|
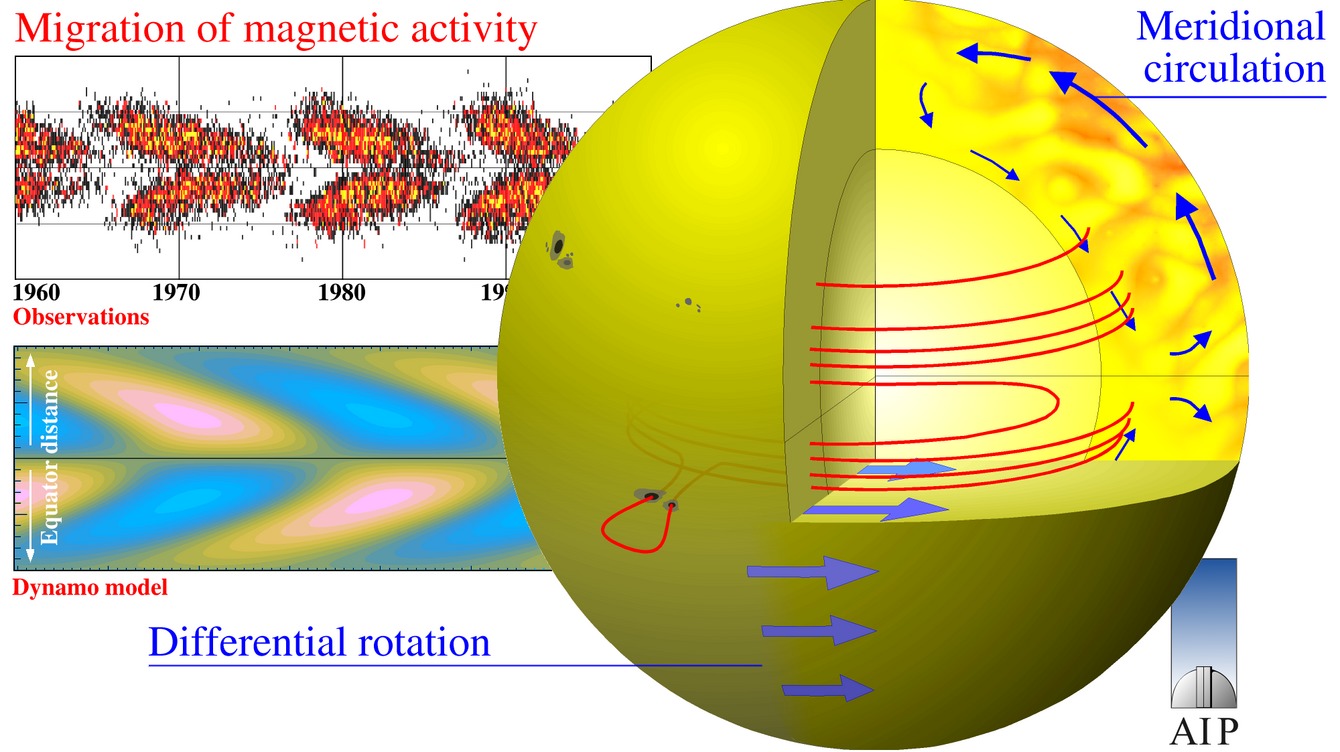
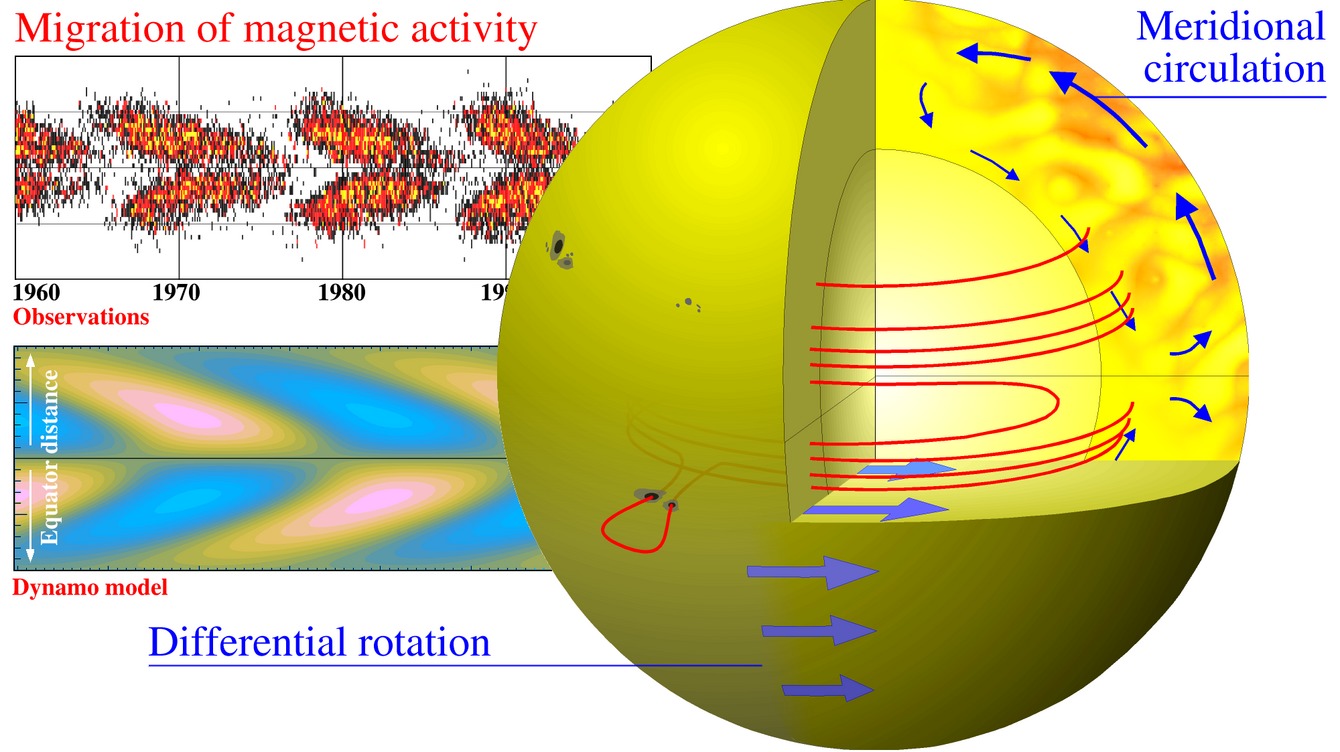
Generation of magnetic fields in the Sun.
The combined action of convection and differential rotation builds up magnetic fields (red).
Models can explain the cyclic activity of the Sun. Observations show that the sunspot
areas on the surface migrate towards the equator with the same cycle. An additional
large-scale meridional circulation is capable of transporting magnetic-field belts
towards the equator. (additional large-size graph, and also without logo).
Graph: R. Arlt
more at http://www.aip.de/~rarlt/medina.pdf (image added 2003-10-30) |
|
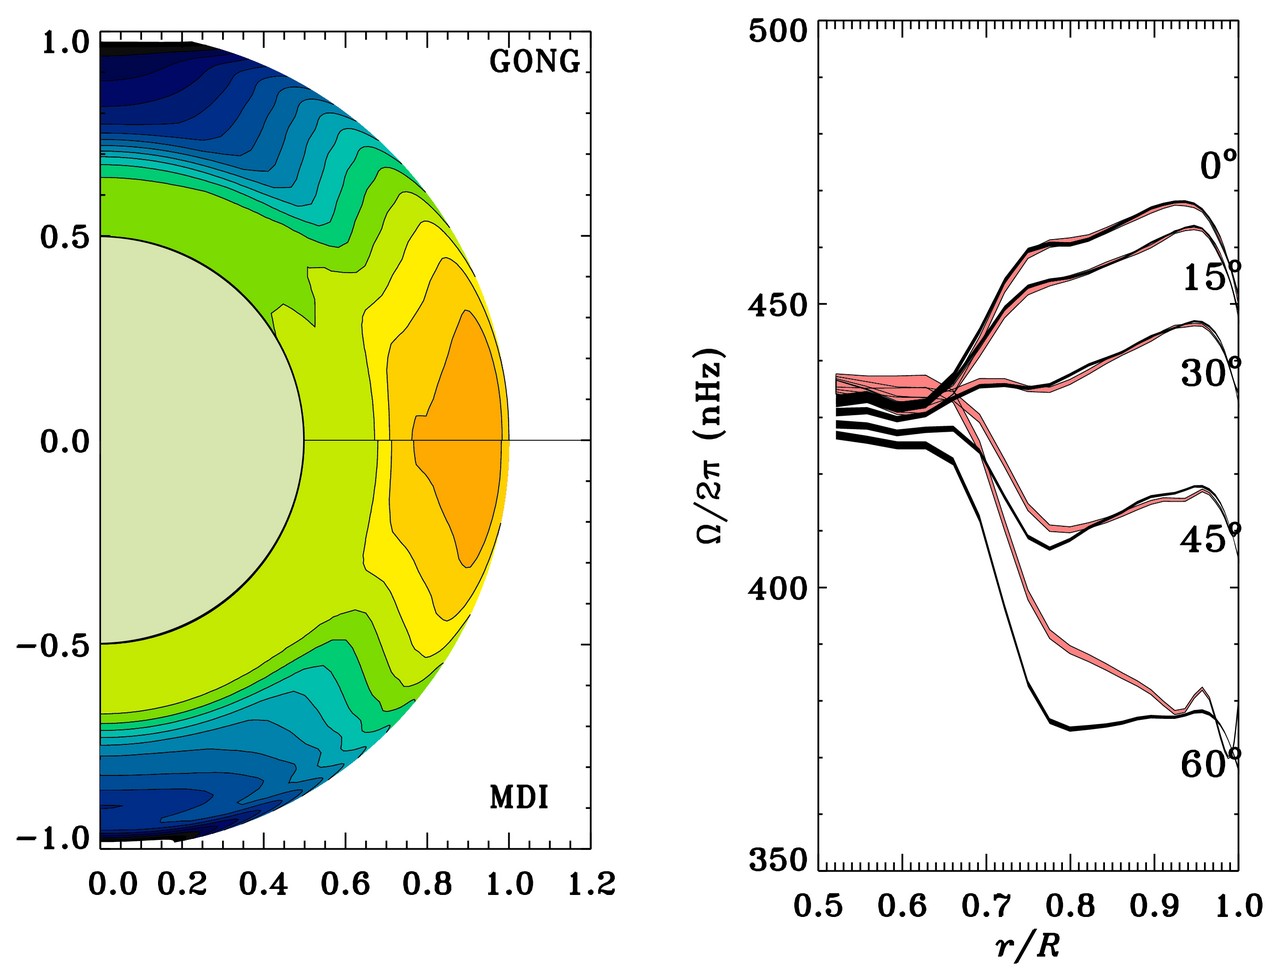
Internal rotation of the Sun. Comparison of data from GONG and MDI. In the right panel, black denotes GONG data, red denotes MDI data. The rotation profile is the result of the inversion of helioseismological data.
Taken from R. Howe, National Solar Observatory, Tucson
more at http://nsokp.nso.edu/ (image added 2003-09-12) |
|
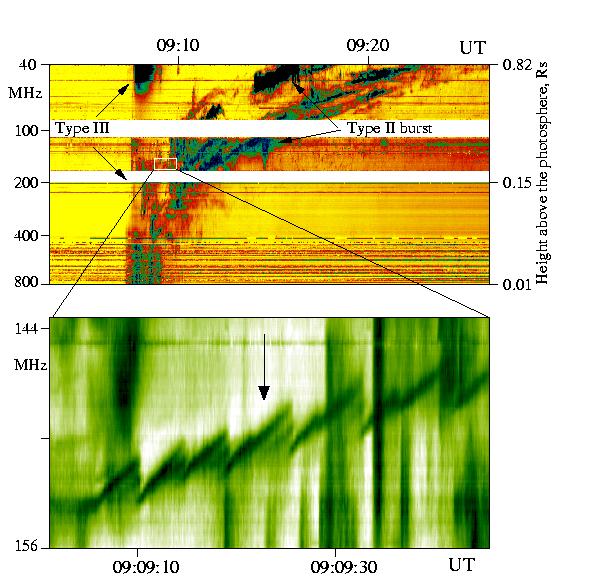
Detection of Sawtooth Oscillations in Solar Flare Radio Emission
Solar flares are violent eruptions suddenly releasing magnetically stored free energy in the form of plasma heating, mass motions, energetic particles, and electromagnetic radiation from radio waves to gamma rays. X-ray and extreme-ultraviolet observations and flare models seem to confirm magnetic reconnection as flare mechanism.
For the first time, we found a spectral fine structure of solar meter wave radio burst emission which can be due to sawtooth oscillations in the hot flare plasma. The sawteeth occur during the impulsive flare phase hard X-ray emission and consist of a sequence of almost identical narrow band (~ 1%) drift bursts. We believe that the radio sawteeth are nonthermal plasma emission due to 2-4% density fluctuations of the flare plasma.
Top: dynamic radio spectrum of the solar flare on 3 November 1997. The radio intensity is color coded where dark means bright emission. The spectrum displays the evolution of radio emission in the corona at heights between about 10 000 and 570 000 km (800-40 MHz). The white and black time-parallel stripes are due to terrestrial interferences. The box contains the sawtooth pattern and is enlarged below.
Bottom: the arrow points to the sawtooth pattern. The period of the sawtooth oscillations is about 5 seconds.
credits: A. Klassen, H. Aurass, G. Mann
more at http://www.aip.de/groups/osra/ (image added 2002-12-09) |
|
A new look at the Sun...
J.P. Wild
more at http://www.aip.de/~kli/ (image added 2002-12-09) |
|
Turbulent flows can be regarded as a superposition of a smooth large-scale and a turbulent small-scale motion. The small-scale part then acts on large-scale motions as an additional stress, the Reynolds stress. While in a non-rotating fluid this stress is just a second viscosity, the Coriolis force causes a non-viscous stress when the fluid rotates. This additional stress, the Lambda effect, is present even in case of rigid body-type rotation and will cause the rotation to become differential, as observed in the outer layers of the Sun.
The rotation pattern is the result of a balance between the Reynolds stress, a small horizontal temperature gradient caused by the Coriolis force, and the meridional flow. The rotation profile resulting from theory closely resembles those found observationally.
The meridional flow and the rotation profile as predicted by theory. The left picture shows the stream function of the meridional flow. Solid lines denote clockwise and dashed contours counterclockwise flow. On the surface as well as at the bottom of the convection zone the flow is directed equatorwards while the gas moves towards the poles at half at intermediate depths. The right plot shows the rotation rate relative to its averave over the whole convection zone.
credits: M. Küker
more at http://www.aip.de/~mku/ (image added 2002-12-09) |
|
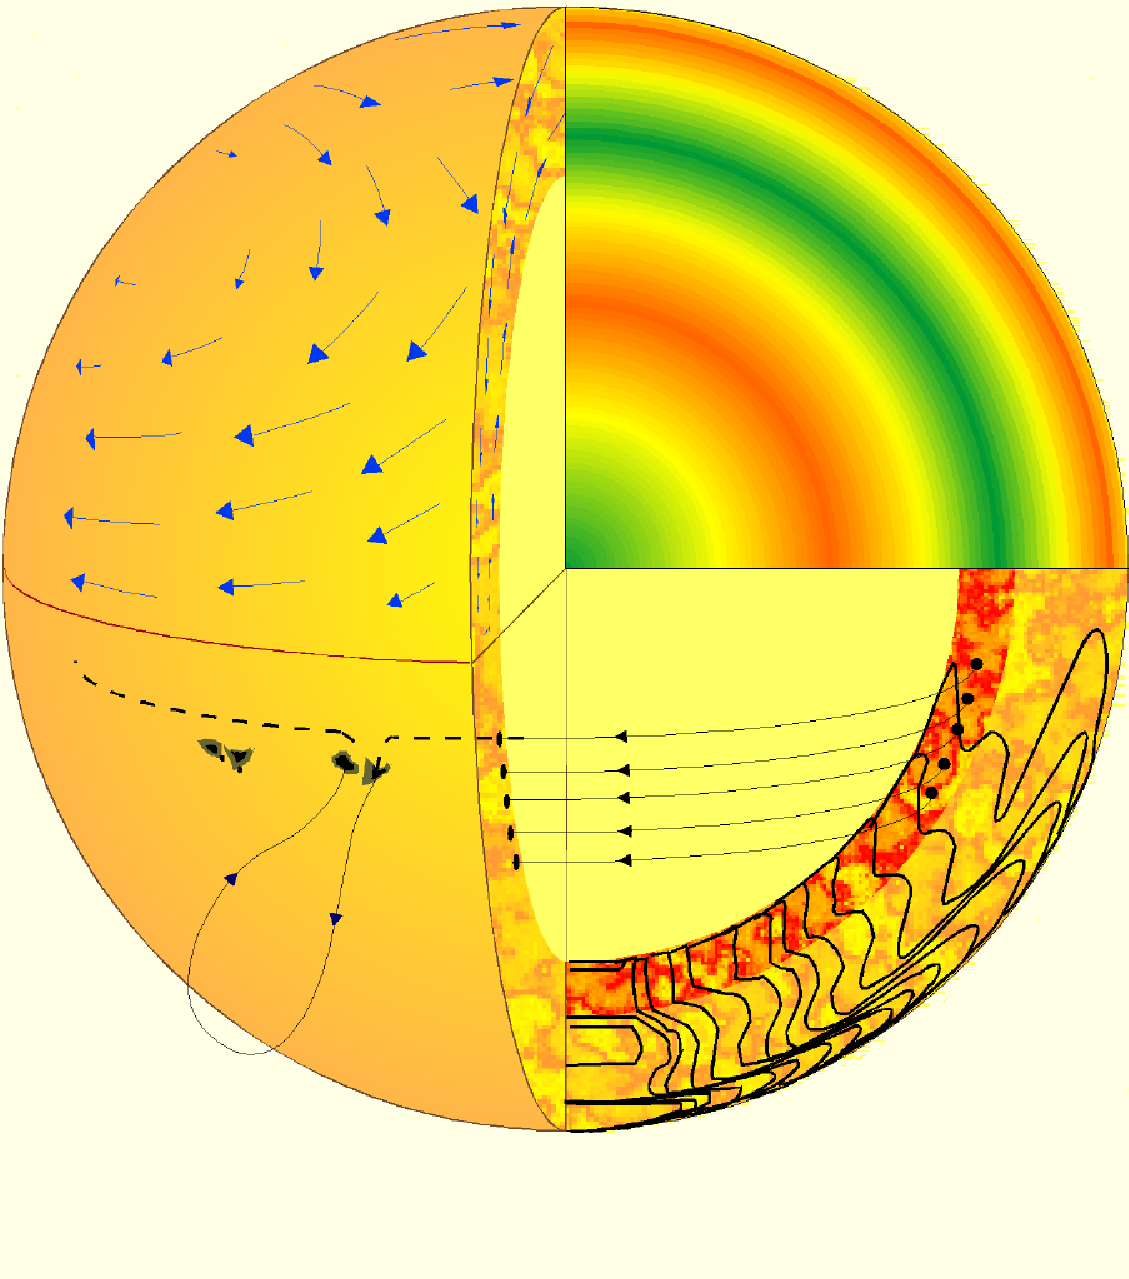
Aspects of the Sun
Various features of the Sun are shown. Upper left quarter: Large-scale surface motions;
upper right: sketch of a radial solar oscillation as a sound wave; lower left: sunspots
and related magnetic fields penetrating the surface - internal field is shown as dashed
line; lower right: convection zone and thin overshoot layer below the convection zone -
differential rotation is indicated by contour lines of the angular velocity.
Graph: R. Arlt, S. Kämmerer
more at http://www.aip.de/~rarlt/ (image added 2003-01-16) |
|
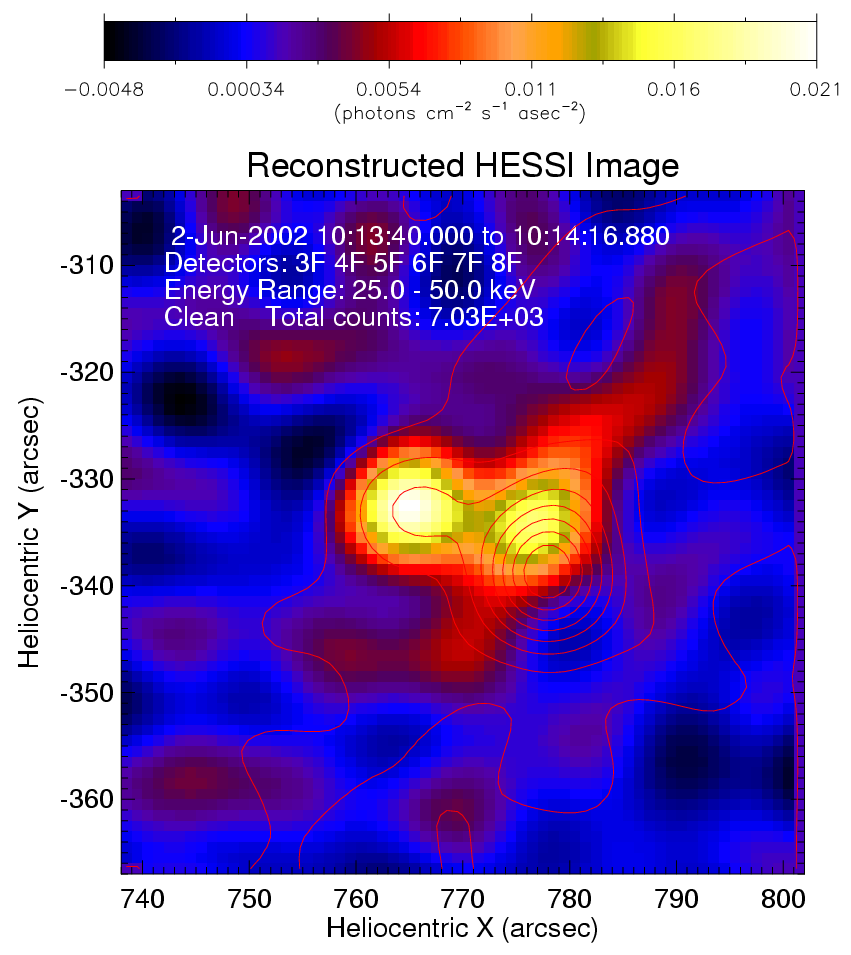
Image of a solar flare reconstructed from observations
by RHESSI
in hard x-rays (25 keV - 50 keV). The spacecraft observes
the explosive energy release in the solar corona. The two
yellow spots are the footpoints of the flare. The spatial
resolution is 10 arc seconds.
G. Mann
more at http://www.aip.de/groups/osra/hessi_mod.html (image added 2003-01-29) |
|
Solar eclipse of 2003 May 31
The eclipse was annular over north-western Europe. This view shows the partial phase of about 72% after sunrise from Zürich, Switzerland.
Photo: R. Arlt
more at http://www.aip.de/~rarlt/ (image added 2003-06-06) |

 last change Sat, 12 Mar 2011 11:52:50 GMT, U. Hanschur


![[full size]](images/arlt_sun_artview_xl.jpg)
![[full size]](images/kitchatinov_penetration_xl.jpg)