A Sea of Light: HETDEX Astronomers Reveal Hidden Structures in the Young Universe
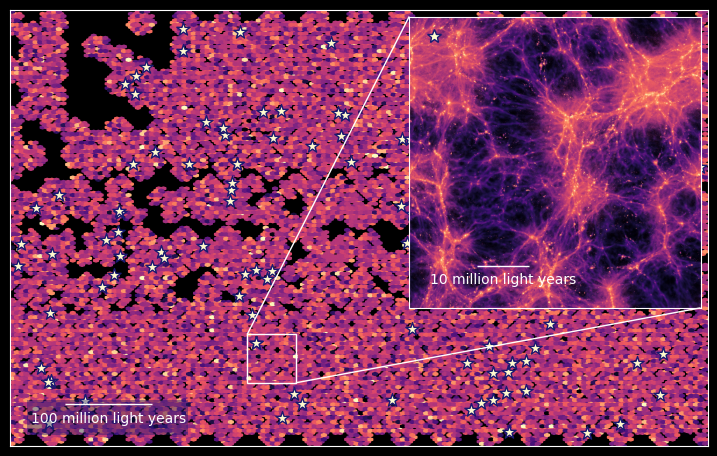
Section of the Line Intensity Map created by charting the distribution and concentration of excited hydrogen (via the Lyman alpha wavelength) in the universe ten billion years ago. The stars mark where HETDEX has found galaxies. The inset simulates the structure present in this map once it is zoomed in on and background noise is removed from the data.
Credit: Chris Byrohl/Stanford University/HETDEX, Maja Lujan Niemeyer/Max-Planck-Institut für Astrophysik/HETDEXAn international research team has used data from the Hobby-Eberly Telescope Dark Energy Experiment (HETDEX) to create the largest and most accurate three-dimensional map to date of what is known as Lyman alpha light—the light emitted by ionized hydrogen in the early universe between 9 and 11 billion years ago. This work, in which scientists from the Leibniz Institute for Astrophysics Potsdam (AIP) were involved, was recently published in The Astrophysical Journal.
Lyman alpha radiation is emitted when hydrogen atoms are excited by high-energy stellar radiation and subsequently release light. Since hydrogen is the most abundant element in the universe, Lyman alpha radiation is an ideal tracer for both, bright galaxies and diffusely distributed gas.
“Observing the early universe gives us an idea of how galaxies evolved into their current form, and what role intergalactic gas played in this process,” says Maja Lujan Niemeyer, a HETDEX scientist and recent graduate from the Max Planck Institute for Astrophysics who led the development of the map.
Prof. Dr. Lutz Wisotzki from the Leibniz Institute for Astrophysics Potsdam (AIP) adds: "With this map we open a new window into the early universe. For the first time we can see not only the galaxies but also the diffuse light between them — a crucial step towards understanding the formation and evolution of cosmic structures."
Observing objects of the early universe is challenging, because many of them are faint and far away. Using a technique called Line Intensity Mapping, the new map pulls these objects into view, adding shape and nuance to this formative era in our universe. Line Intensity Mapping charts the distribution of spectral line emission and concentration of specific elements across an entire region, rather than observing objects one-by-one. Although Line Intensity Mapping is not a new technique, this is the first time it has been used to chart Lyman alpha emissions over a large area in the sky and with such high precision.
Using HETDEX, the team mapped the positions of approximately one million Lyman alpha-emitting galaxies from the cosmic epoch of peak star formation in the universe. Their analysis shows that the total Lyman alpha photon budget in the universe can be fully explained by the action of newly formed stars in galaxies. The scientists further discovered that the so-called Lyman alpha halos known to surround galaxies are much larger than previously assumed and even overlap each other.
Moving forward, the team plans to compare their map with observational data of different elements covering the same region of the universe. For example, a Line Intensity Map of carbon monoxide - which is associated with the dense and extremely cold gas clouds inside galaxies where new stars form - would add valuable insights into the conditions of star formation in the young Universe.
AIP is partner of the Hobby-Eberly Telescope Dark Energy Experiment (HETDEX), which is one of several research projects worldwide, trying to measure the properties and effects of dark energy.
Further information
Niemeyer et al. 2026: Lyα Intensity Mapping in HETDEX: Galaxy-Lyα Intensity Cross-Power Spectrum, https://iopscience.iop.org/article/10.3847/1538-4357/ae3a98
Hobby-Eberly Telescope Dark Energy Experiment (HETDEX):
Images

Section of the Line Intensity Map created by charting the distribution and concentration of excited hydrogen (via the Lyman alpha wavelength) in the universe ten billion years ago. The stars mark where HETDEX has found galaxies. The inset simulates the structure present in this map once it is zoomed in on and background noise is removed from the data.